Why your app turned into spaghetti

"I do not like your software sir,
your architecture's poor.Your users can't do anything,
unless you code some more.This isn't how it used to be,
we had this figured out.But then you had to mess it up
by moving into clouds."
There's a certain kind of programmer. Let's call him Stanley.
Stanley has been around for a while, and has his fair share of war stories. The common thread is that poorly conceived and specced solutions lead to disaster, or at least, ongoing misery. As a result, he has adopted a firm belief: it should be impossible for his program to reach an invalid state.
Stanley loves strong and static typing. He's a big fan of pattern matching, and enums, and discriminated unions, which allow correctness to be verified at compile time. He also has strong opinions on errors, which must be caught, logged and prevented. He uses only ACID-compliant databases, wants foreign keys and triggers to be enforced, and wraps everything in atomic transactions.
He hates any source of uncertainty or ambiguity, like untyped JSON or plain-text markup. His APIs will accept data only in normalized and validated form. When you use a Stanley lib, and it doesn't work, the answer will probably be: "you're using it wrong."
Stanley is most likely a back-end or systems-level developer. Because nirvana in front-end development is reached when you understand that this view of software is not just wrong, but fundamentally incompatible with the real world.
I will prove it.

State Your Intent
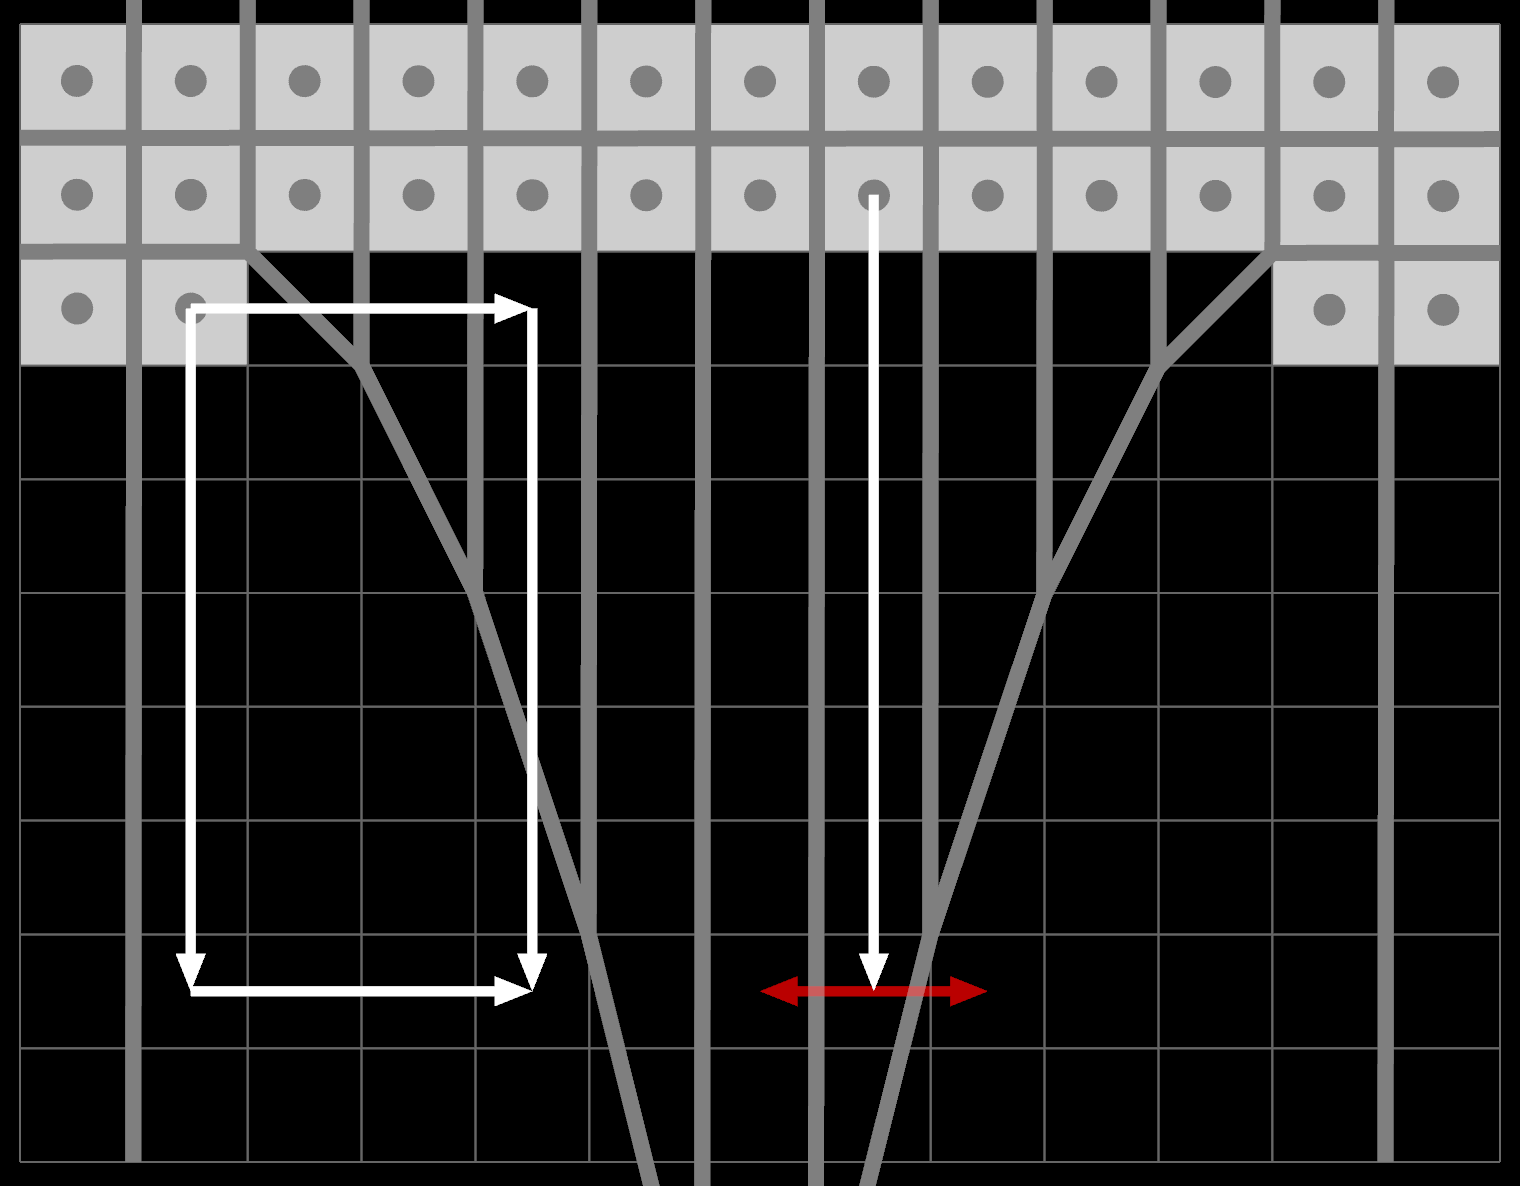
Take a text editor. What happens if you press the up and down arrows?
The keyboard cursor (aka caret) moves up and down. Duh. Except it also moves left and right.
The editor state at the start has the caret on line 1 column 6. Pressing down will move it to line 2 column 6. But line 2 is too short, so the caret is forcibly moved left to column 1. Then, pressing down again will move it back to column 6.
It should be obvious that any editor that didn't remember which column you were actually on would be a nightmare to use. You know it in your bones. Yet this only works because the editor allows the caret to be placed on a position that "does not exist." What is the caret state in the middle? It is both column 1 and column 6.
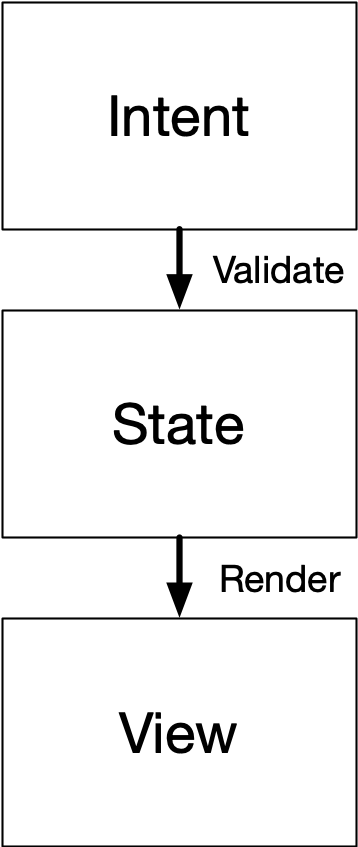
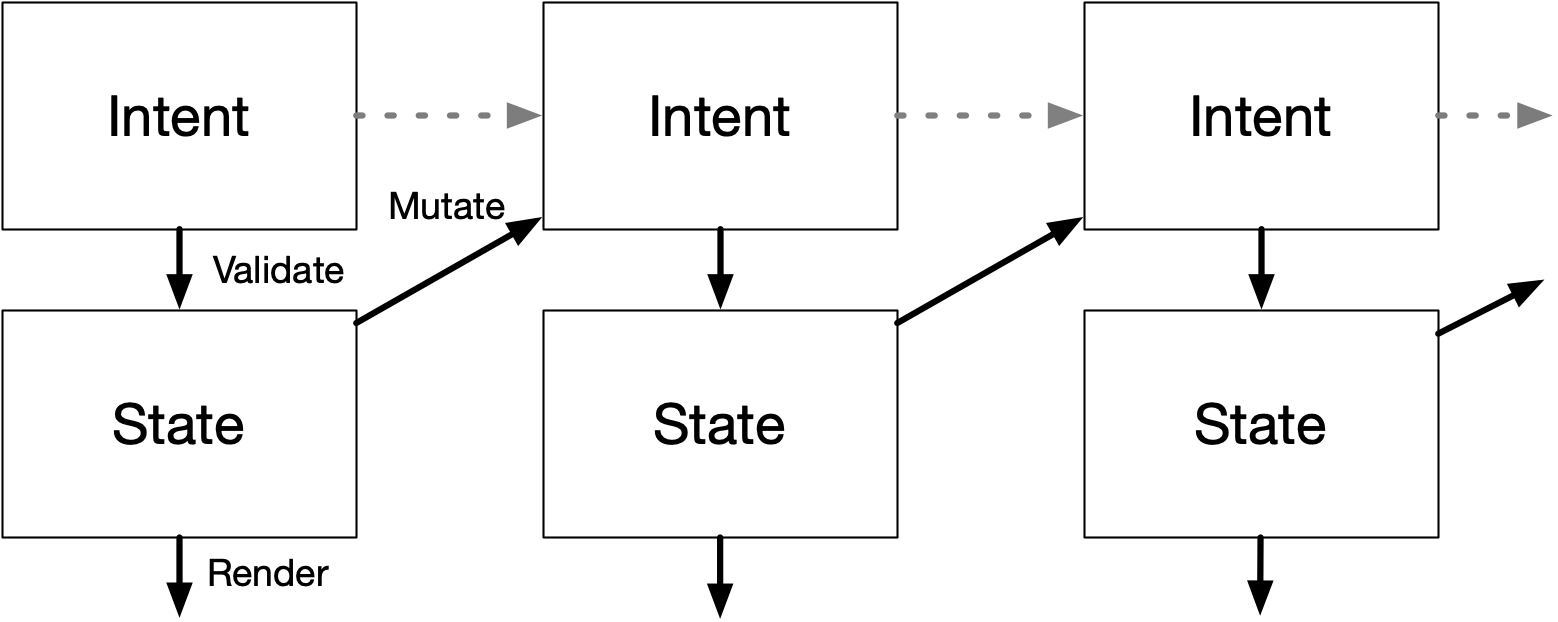
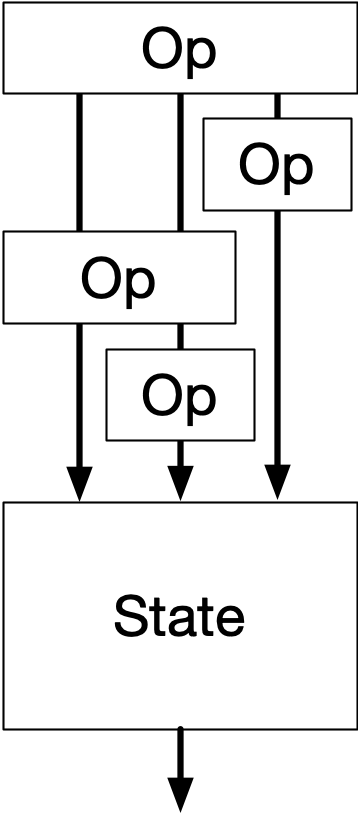
To accommodate this, you need more than just a View that is a pure function of a State, as is now commonly taught. Rather, you need an Intent, which is the source of truth that you mutate... and which is then parsed and validated into a State. Only then can it be used by the View to render the caret in the right place.
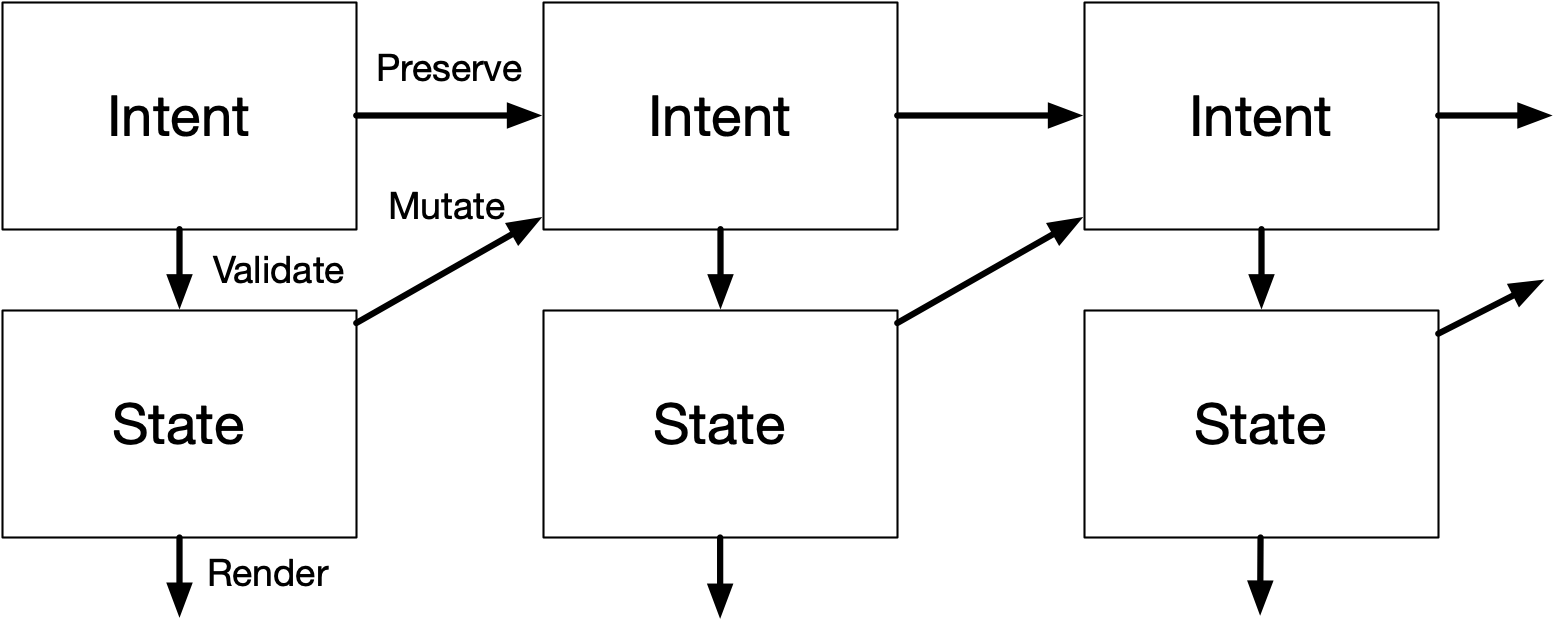
To edit the intent, aka what a classic Controller does, is a bit tricky. When you press left/right, it should determine the new Intent.column based on the validated State.column +/- 1. But when you press up/down, it should keep the Intent.column you had before and instead change only Intent.line. New intent is a mixed function of both previous intent and previous state.
The general pattern is that you reuse Intent if it doesn't change, but that new computed Intent should be derived from State. Note that you should still enforce normal validation of Intent.column when editing too: you don't allow a user to go past the end of a line. Any new intent should be as valid as possible, but old intent should be preserved as is, even if non-sensical or inapplicable.
Functionally, for most of the code, it really does look and feel as if the state is just State, which is valid. It's just that when you make 1 state change, the app may decide to jump into a different State than one would think. When this happens, it means some old intent first became invalid, but then became valid again due to a subsequent intent/state change.
This is how applications actually work IRL. FYI.

Knives and Forks
I chose a text editor as an example because Stanley can't dismiss this as just frivolous UI polish for limp wristed homosexuals. It's essential that editors work like this.
The pattern is far more common than most devs realize:
- A tree view remembers the expand/collapse state for rows that are hidden.
- Inspector tabs remember the tab you were on, even if currently disabled or inapplicable.
- Toggling a widget between type A/B/C should remember all the A, B and C options, even if mutually exclusive.
All of these involve storing and preserving something unknown, invalid or unused, and bringing it back into play later.
More so, if software matches your expected intent, it's a complete non-event. What looks like a "surprise hidden state transition" to a programmer is actually the exact opposite. It would be an unpleasant surprise if that extra state transition didn't occur. It would only annoy users: they already told the software what they wanted, but it keeps forgetting.
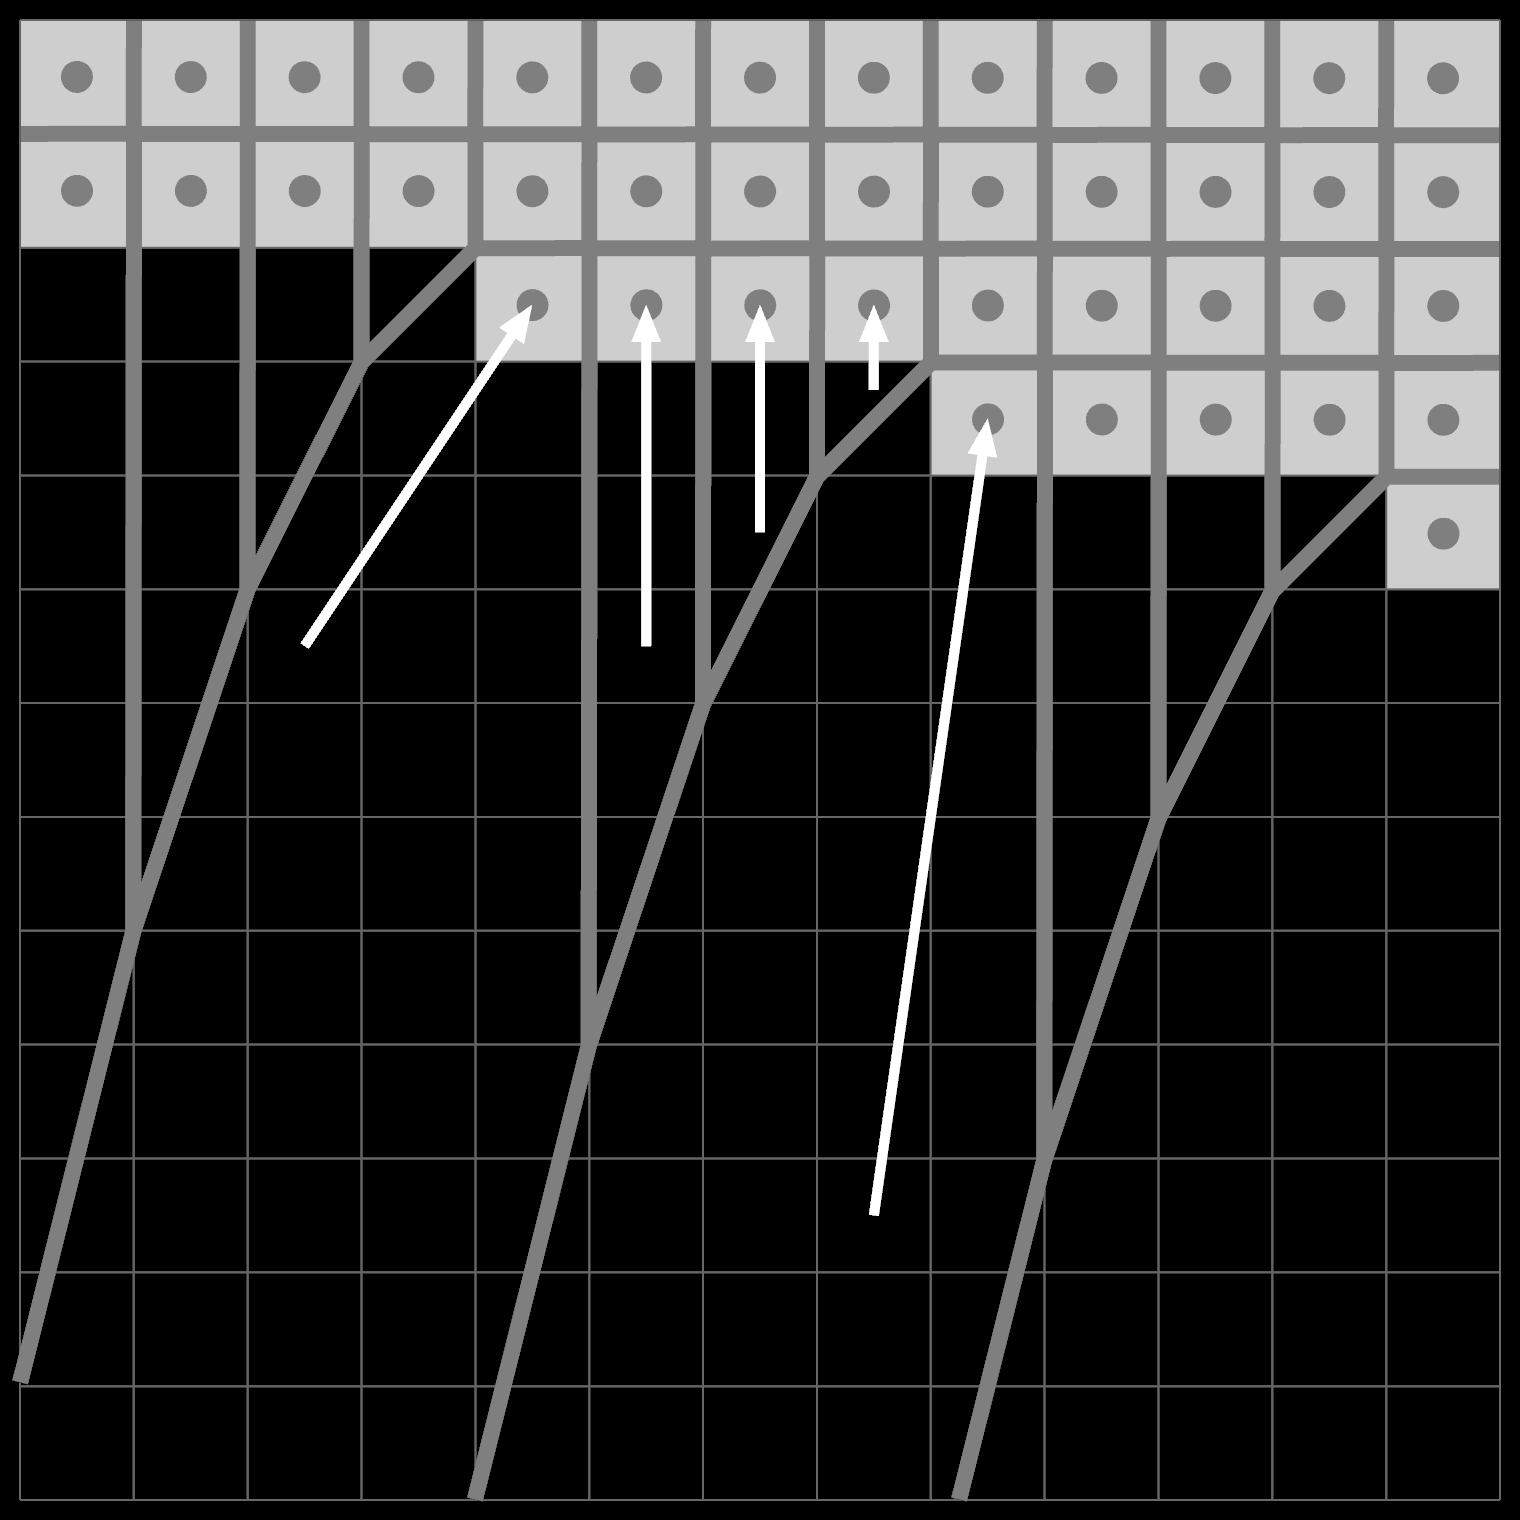
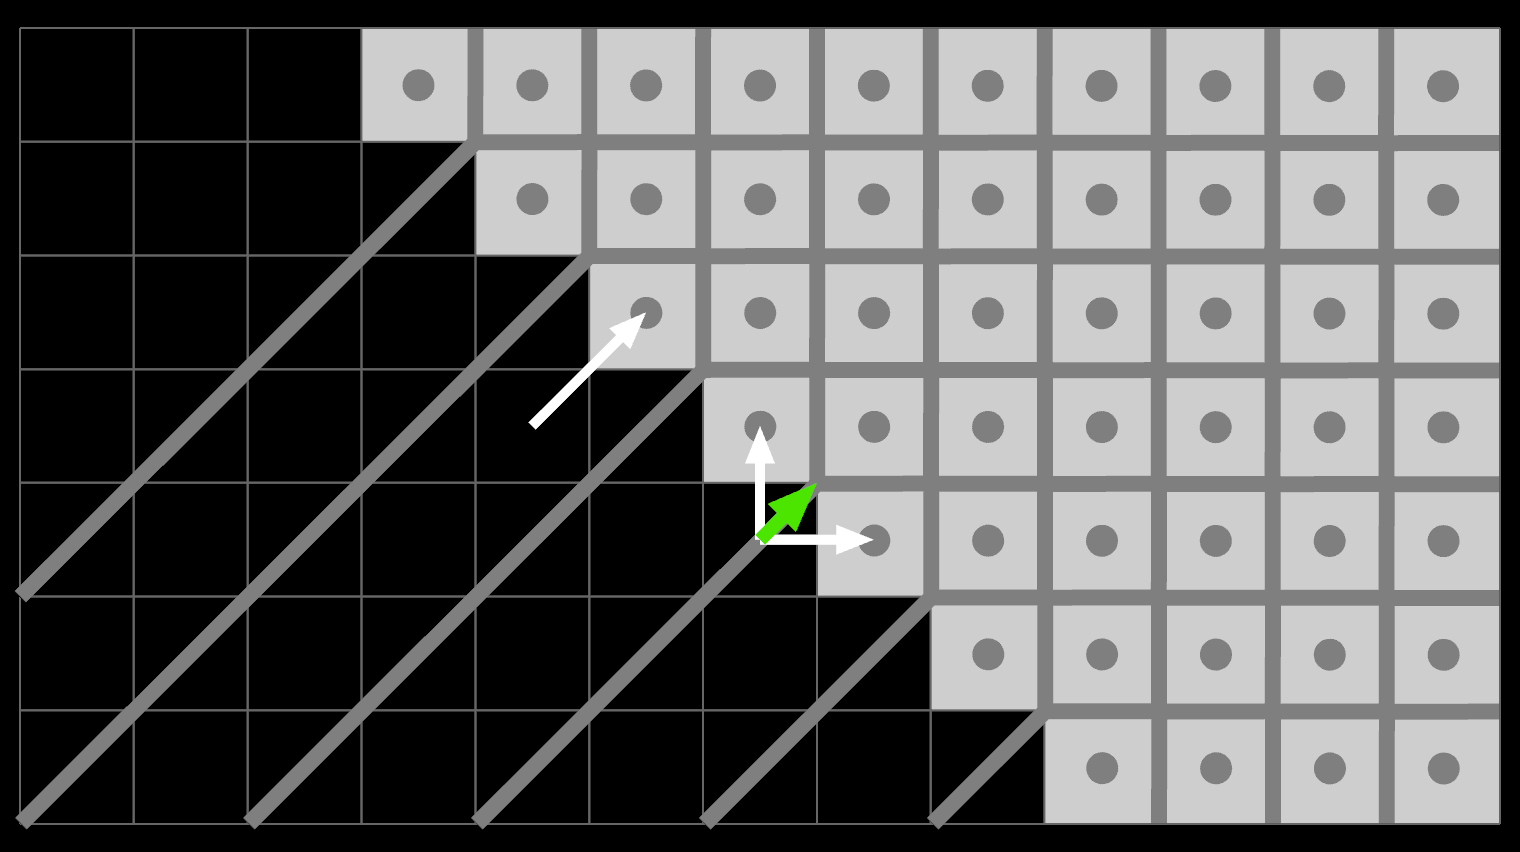
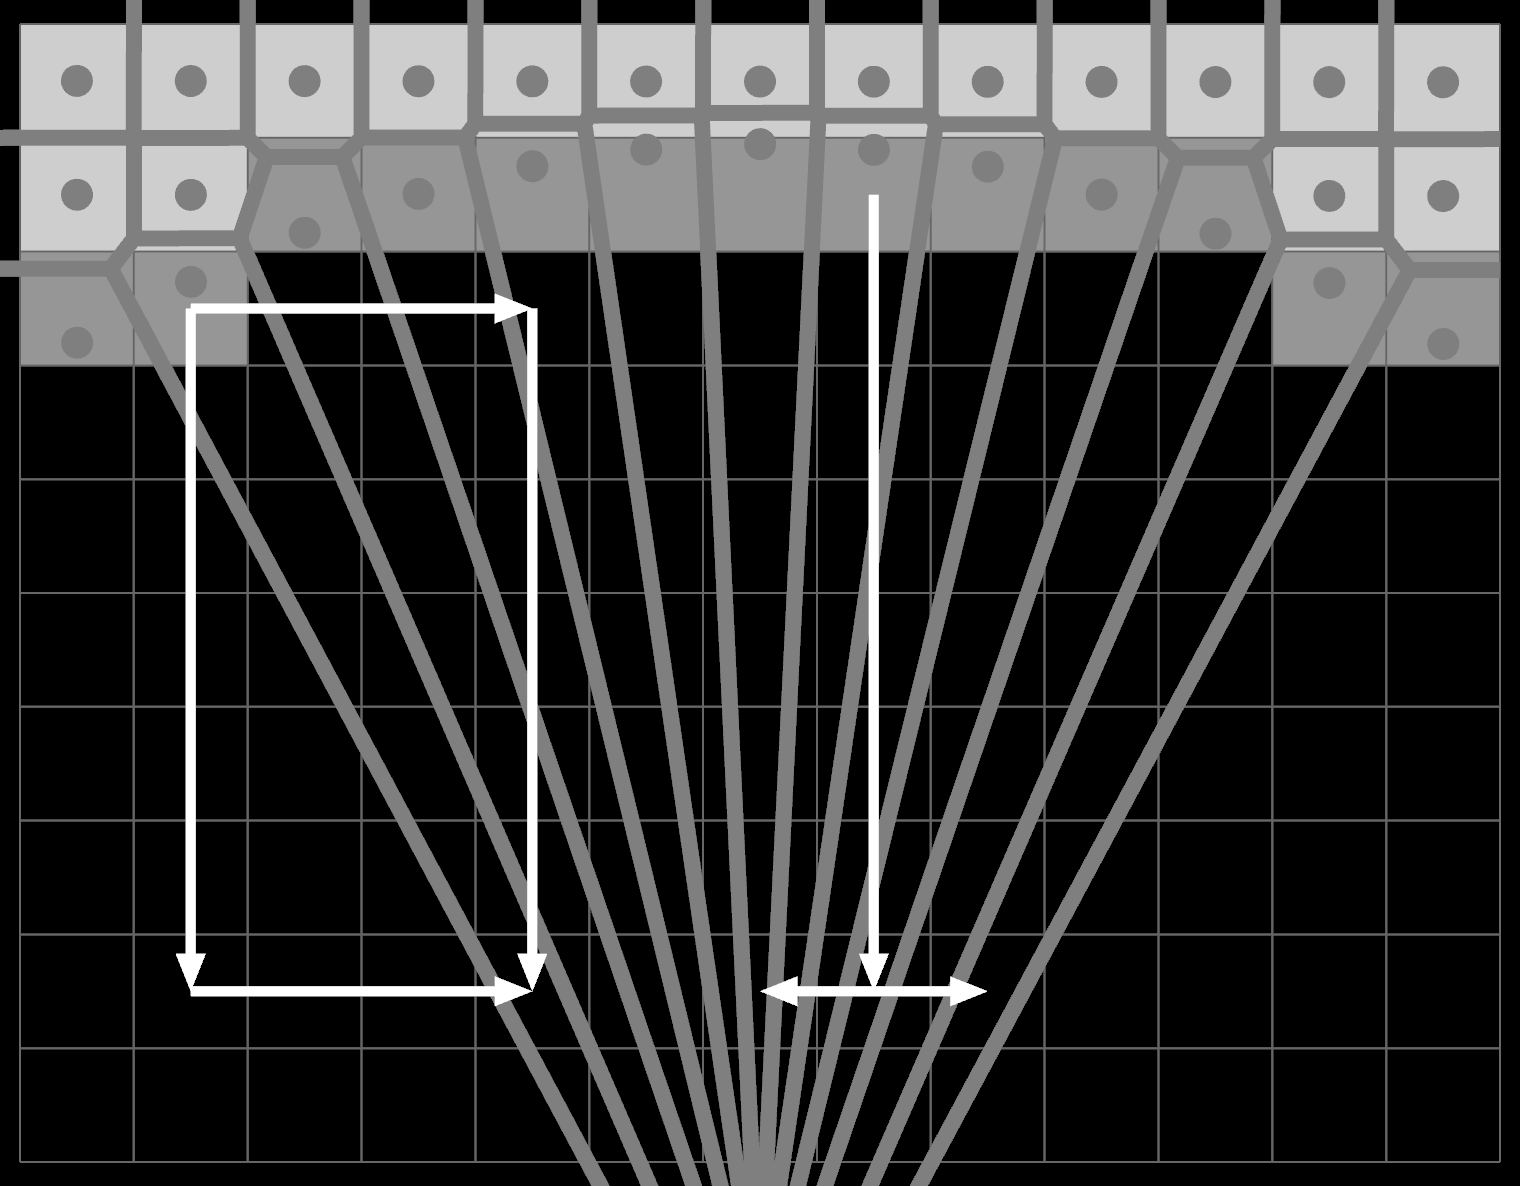
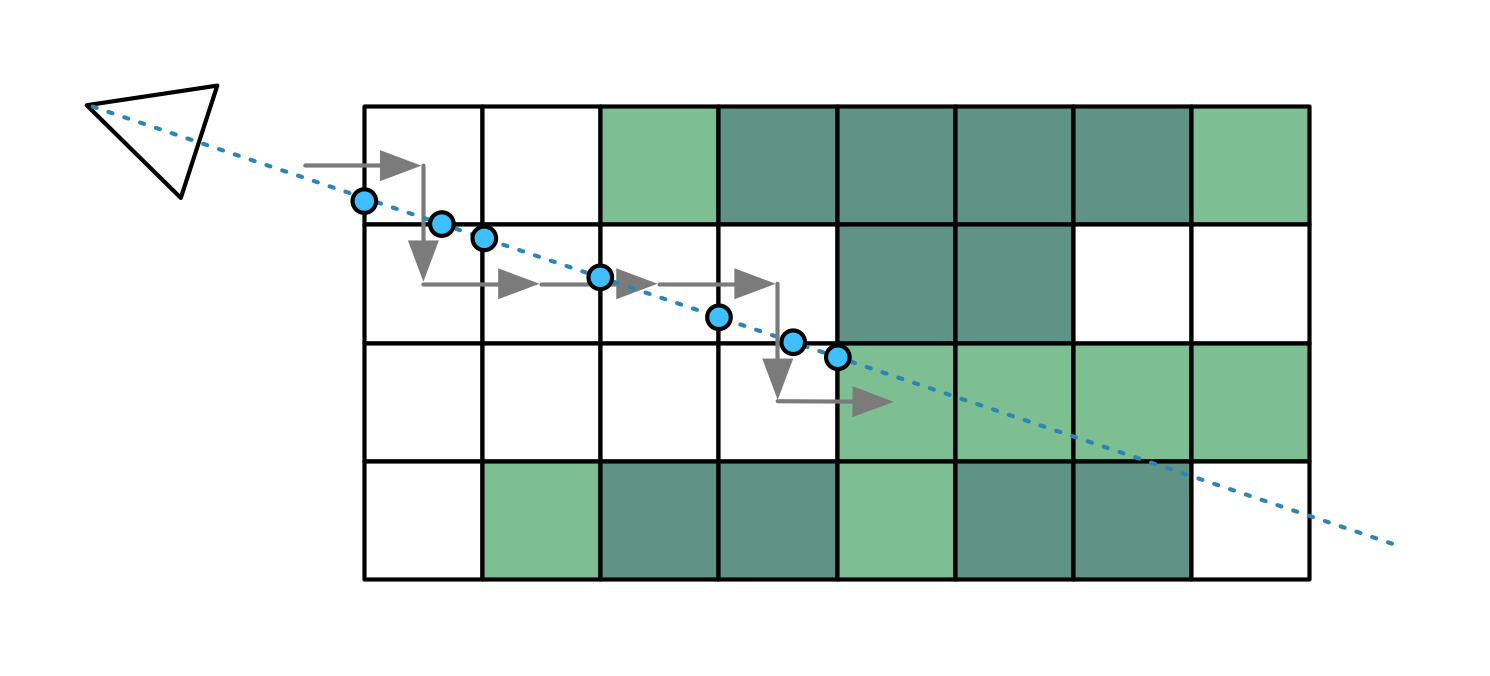
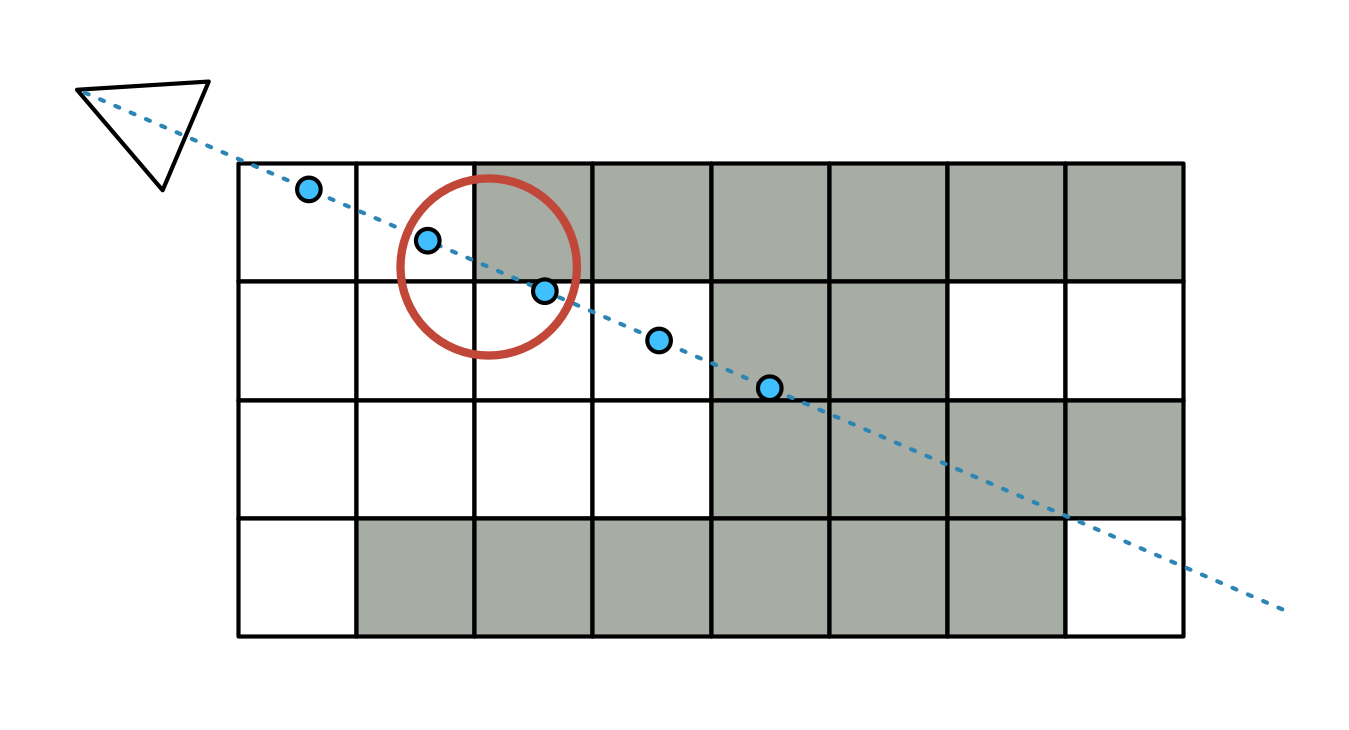
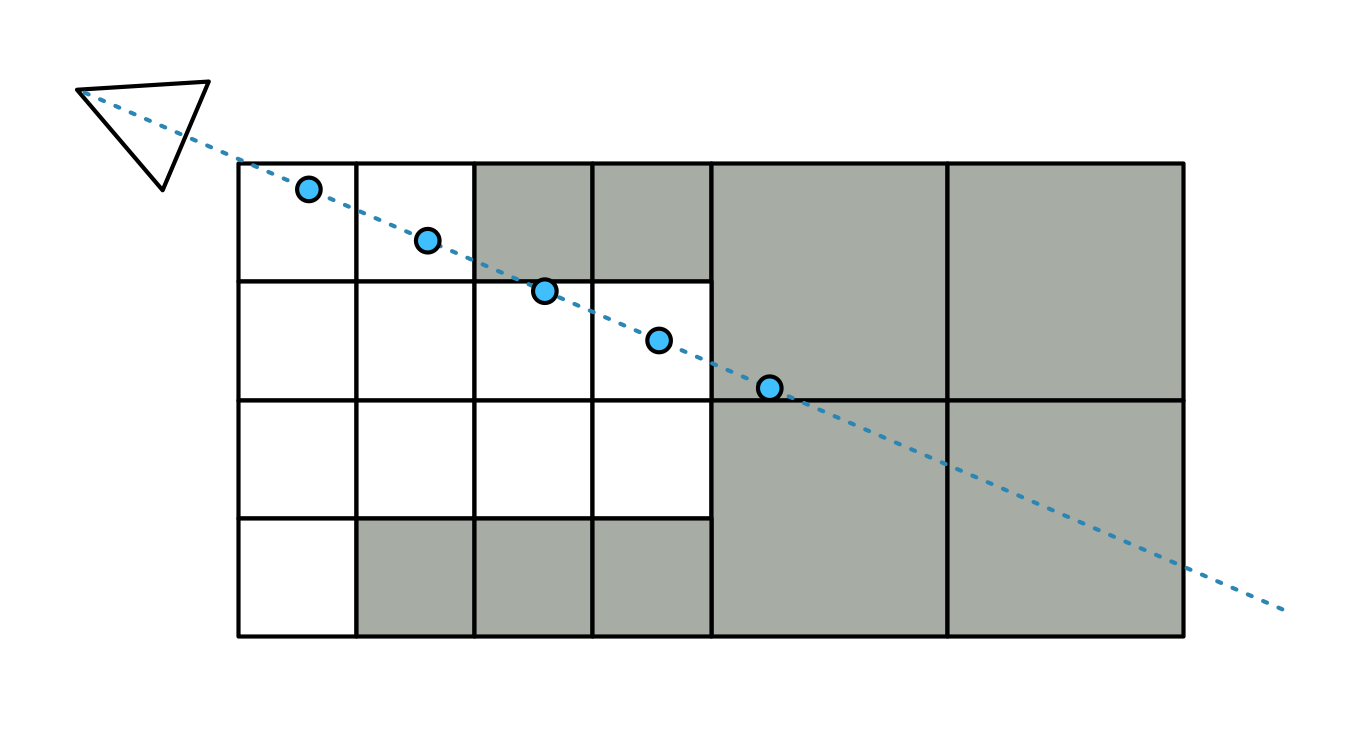
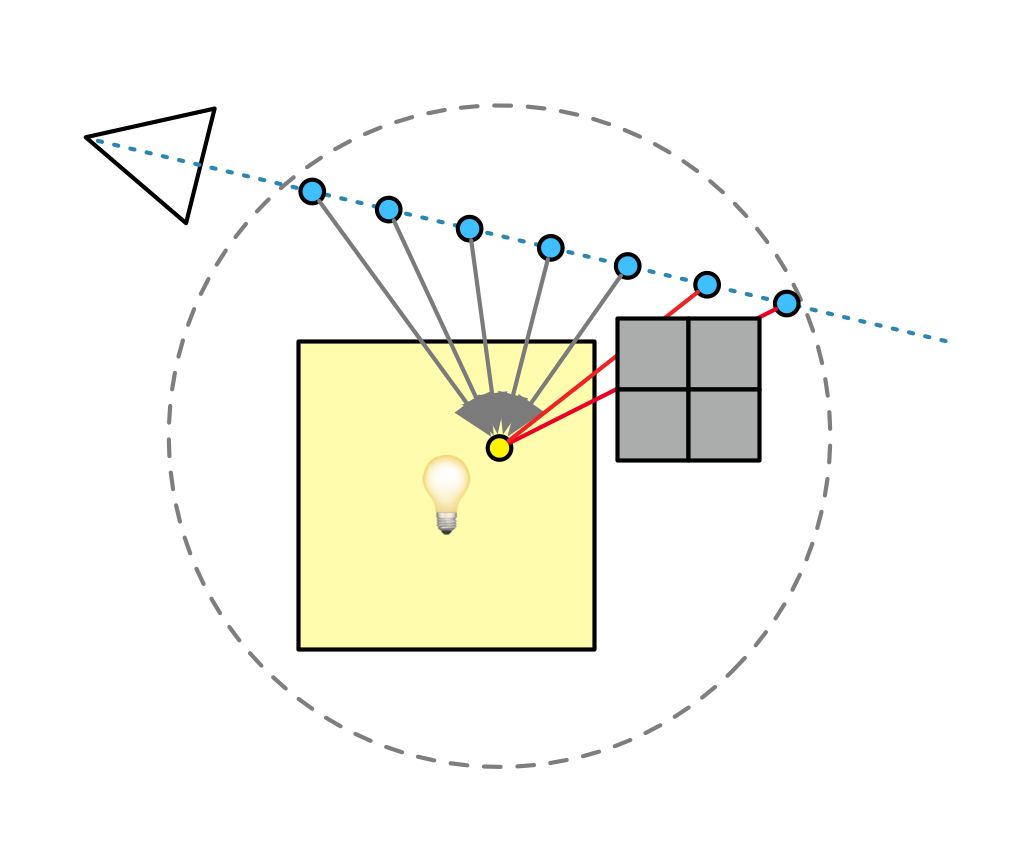
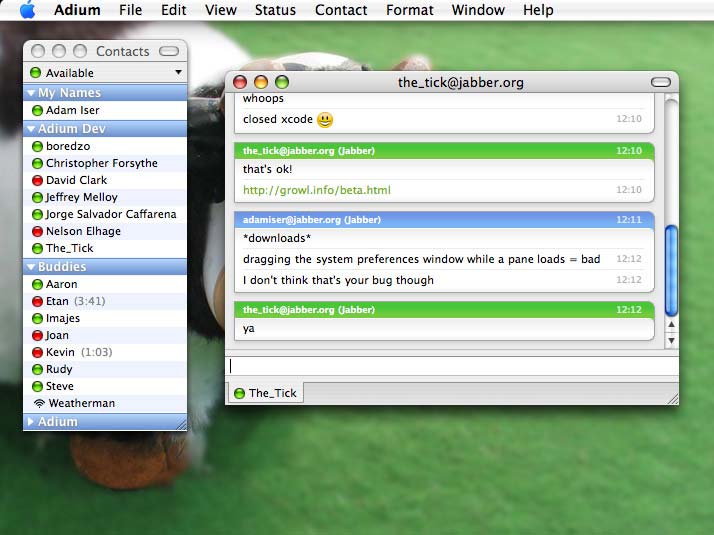
The ur-example is how nested popup menus should work: good implementations track the motion of the cursor so you can move diagonally from parent to child, without falsely losing focus:
This is an instance of the goalkeeper's curse: people rarely compliment or notice the goalkeeper if they do their job, only if they mess up. Successful applications of this principle are doomed to remain unnoticed and unstudied.
Validation is not something you do once, discarding the messy input and only preserving the normalized output. It's something you do continuously and non-destructively, preserving the mess as much as possible. It's UI etiquette: the unspoken rules that everyone expects but which are mostly undocumented folklore.
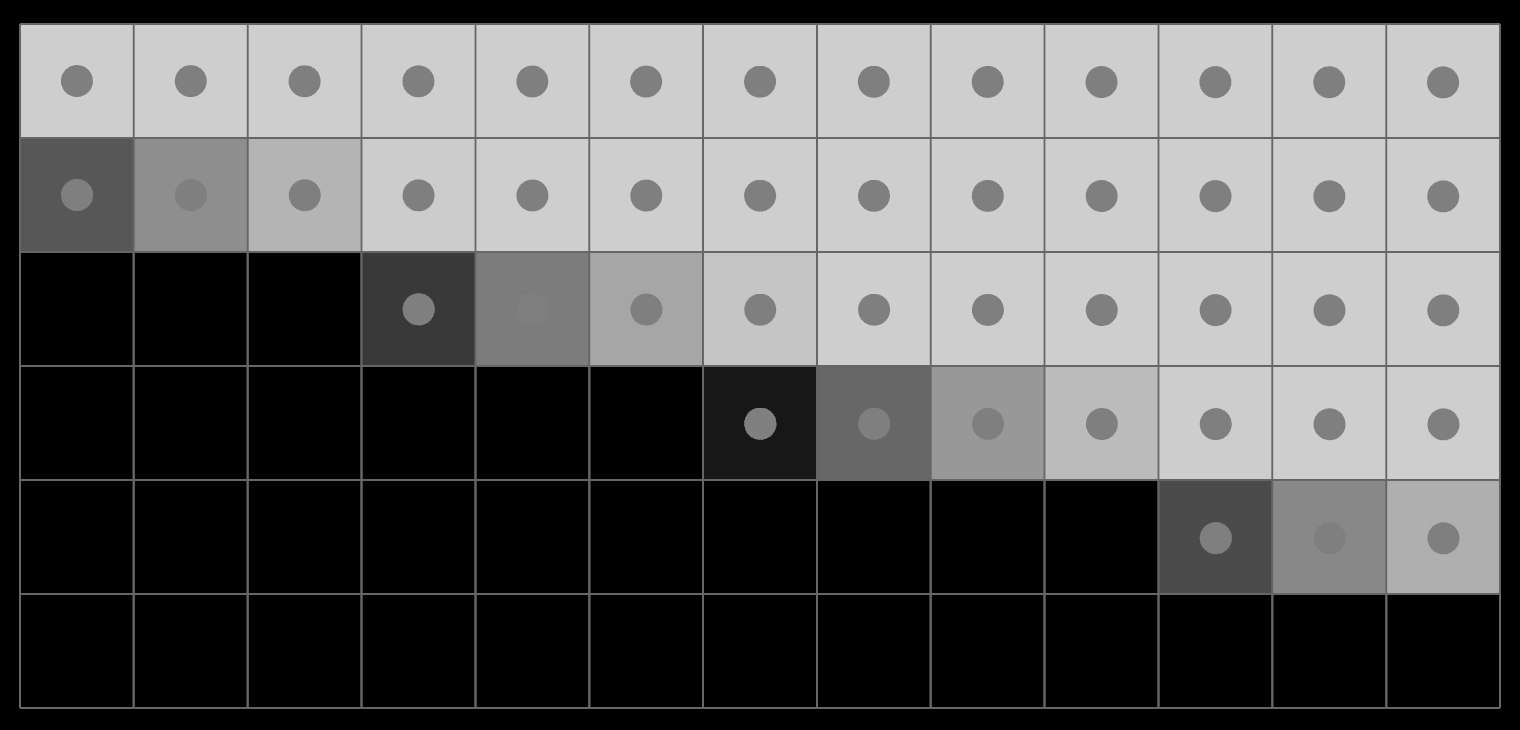
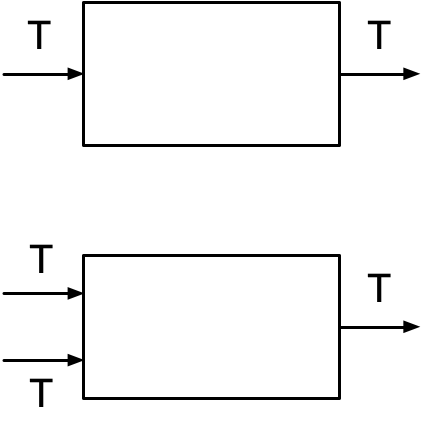
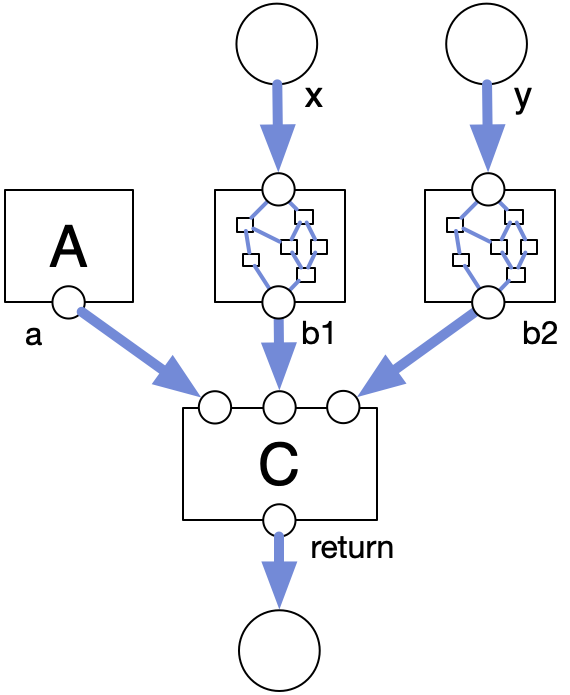
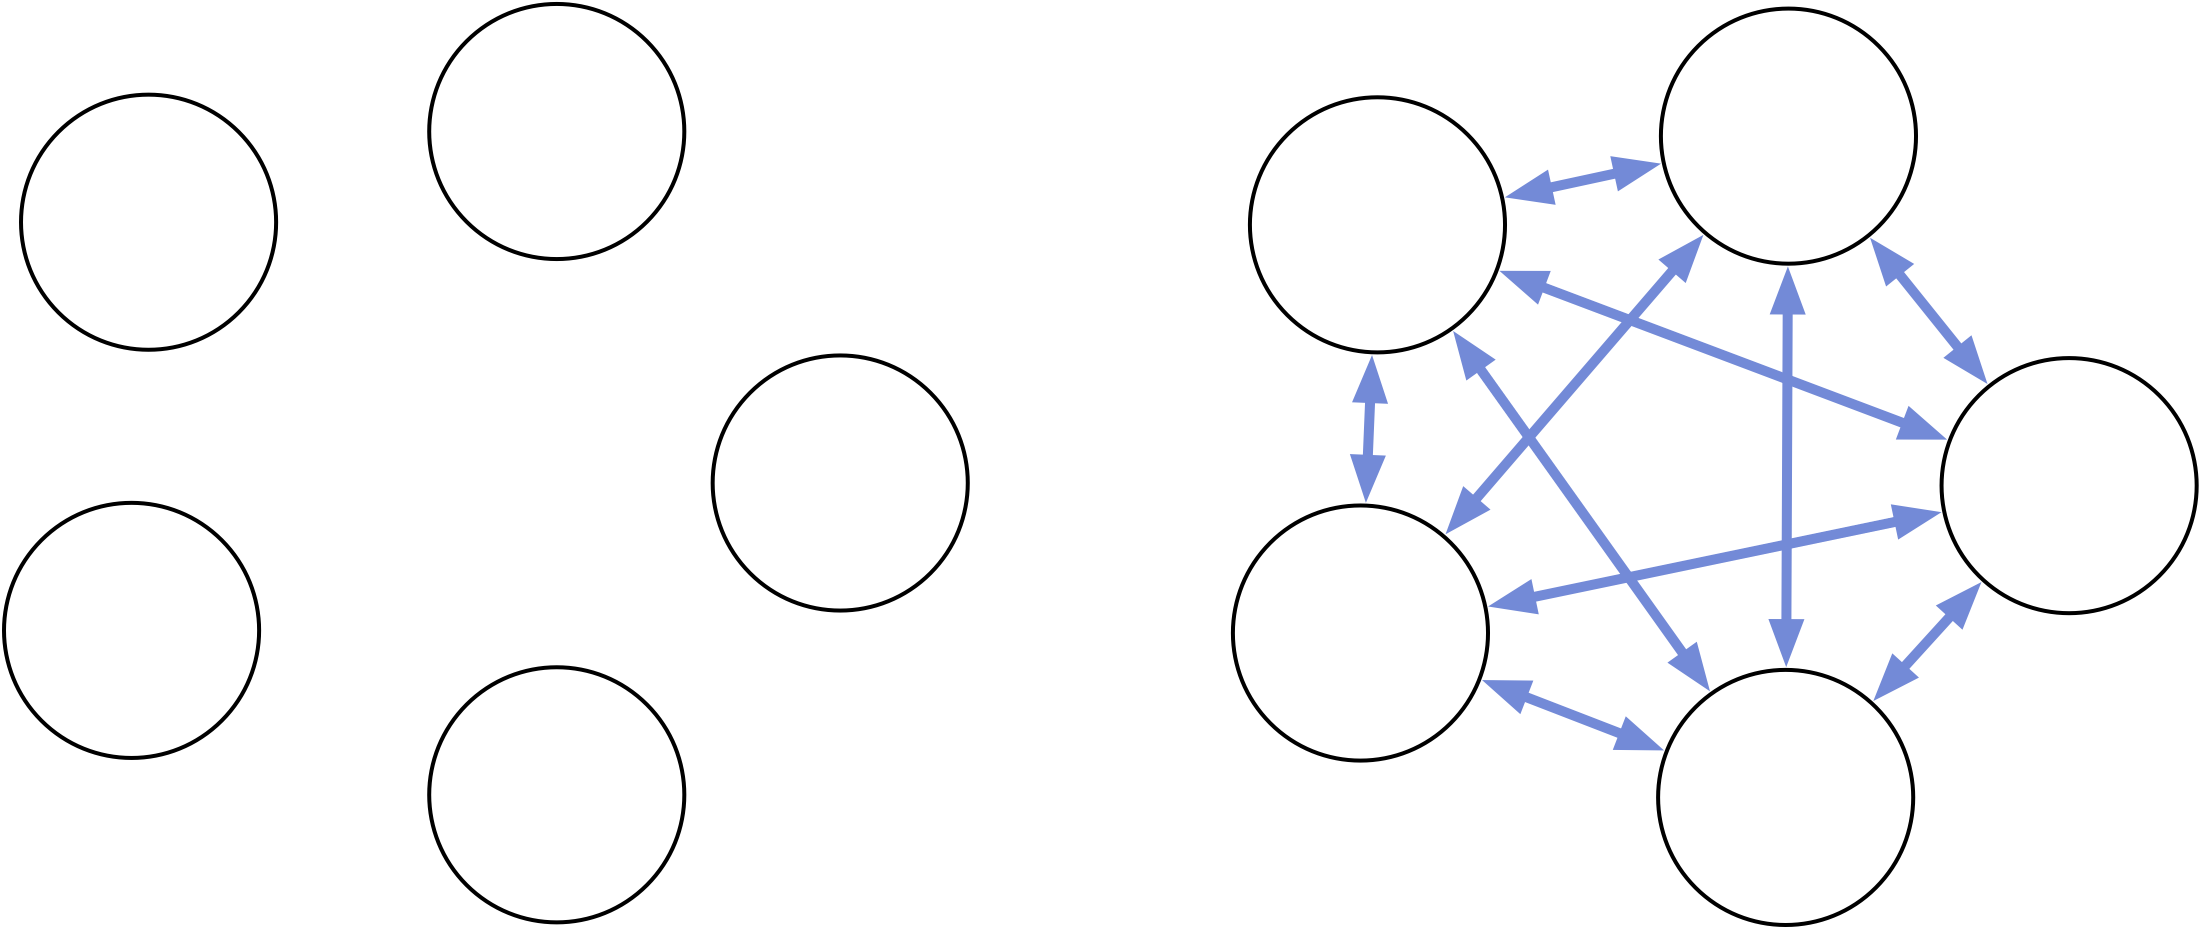
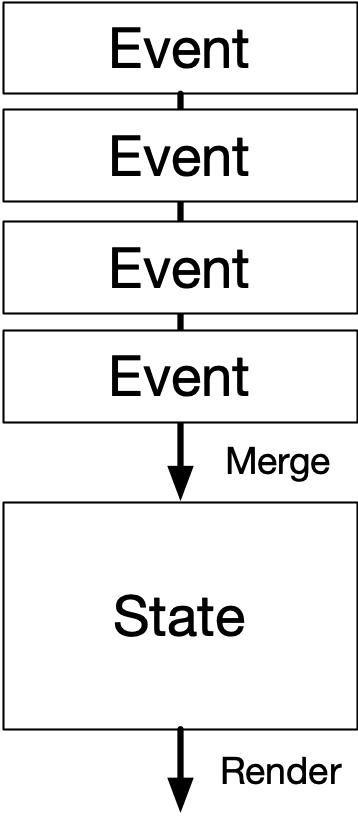
This poses a problem for most SaaS in the wild, both architectural and existential. Most APIs will only accept mutations that are valid. The goal is for the database to be a sequence of fully valid states:
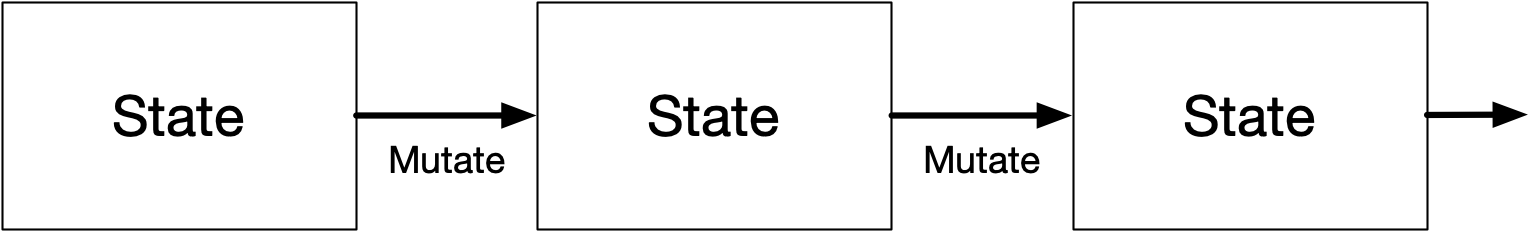
The smallest possible operation in the system is a fully consistent transaction. This flattens any prior intent.
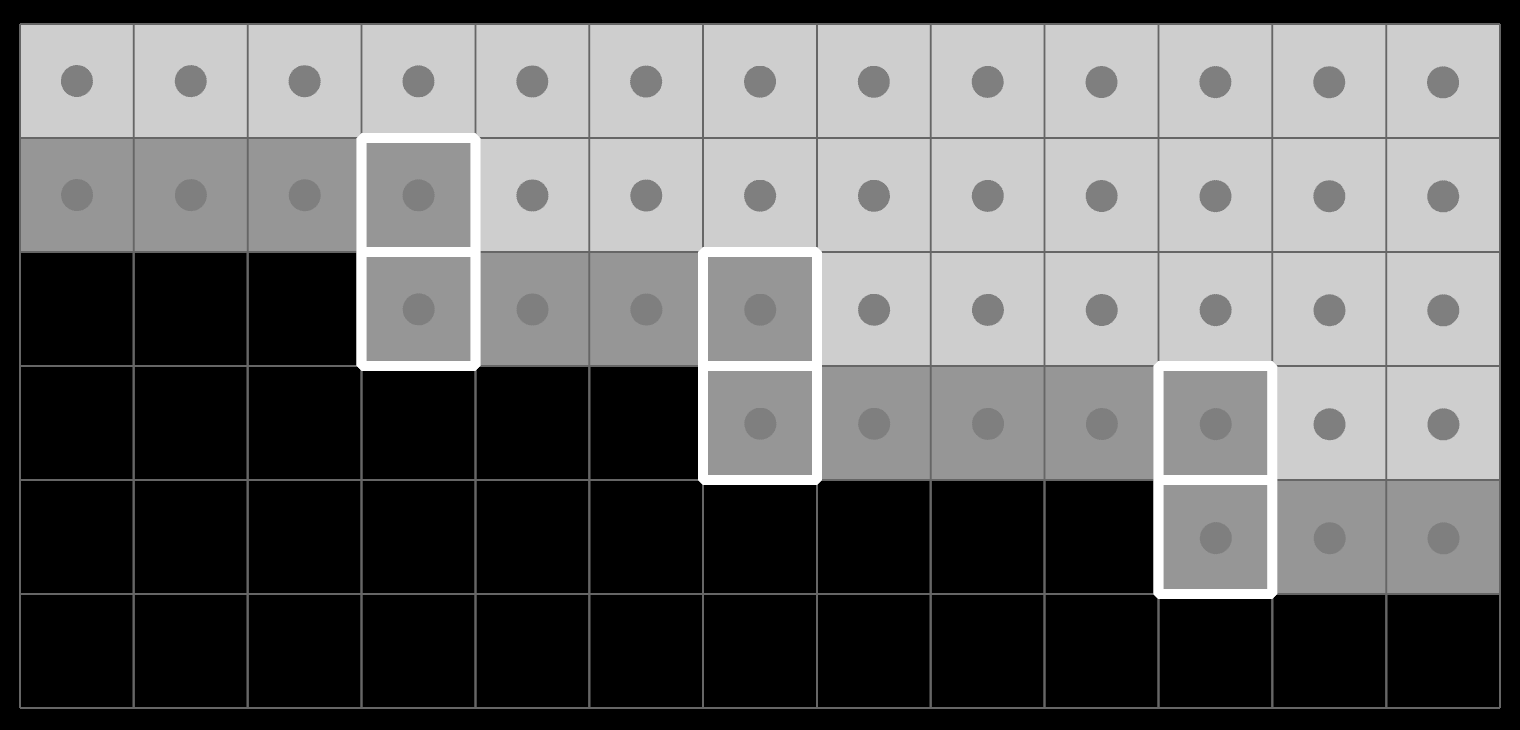
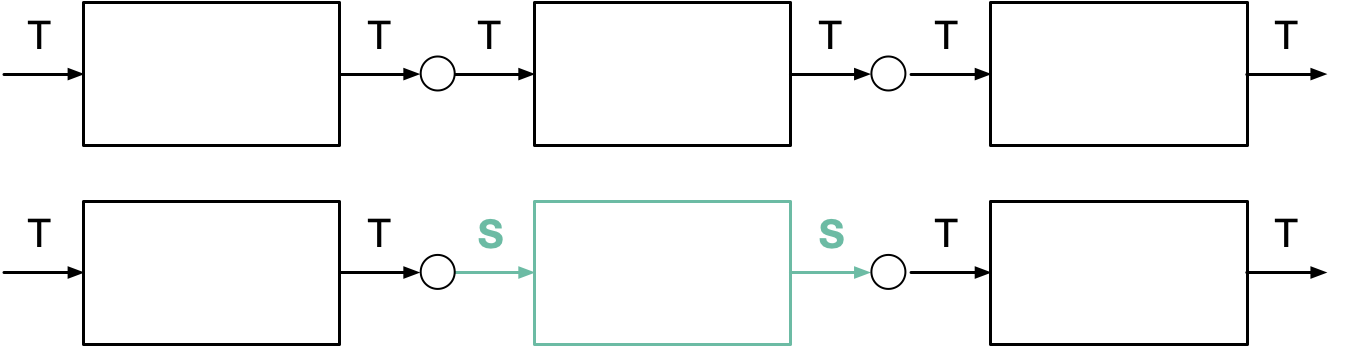
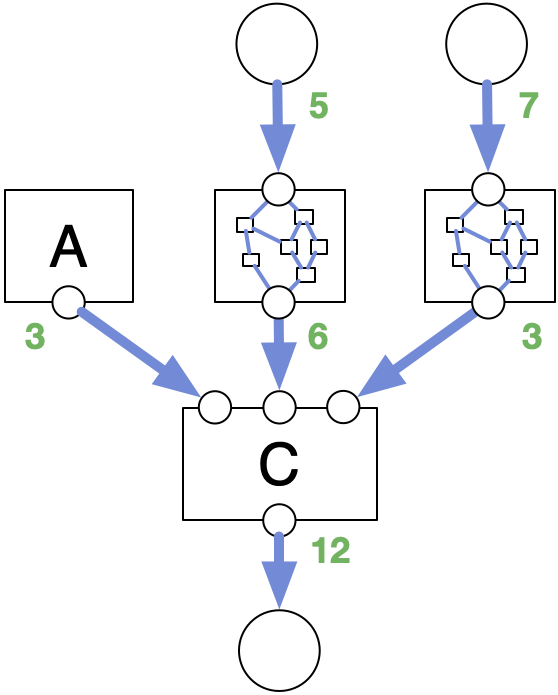
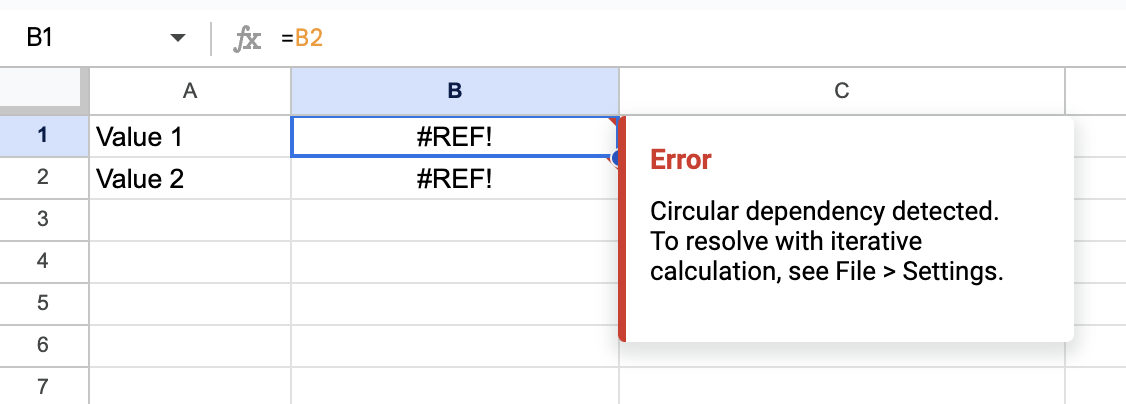
In practice, many software deviates from this ad-hoc. For example, spreadsheets let you create cyclic references, which is by definition invalid. The reason it must let you do this is because fixing one side of a cyclic reference also fixes the other side. A user wants and needs to do these operations in any order. So you must allow a state transition through an invalid state:
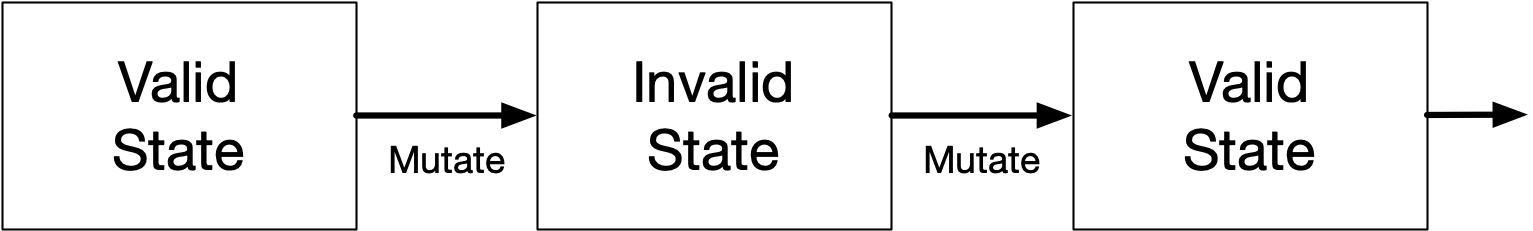
This requires an effective Intent/State split, whether formal or informal.

Because cyclic references can go several levels deep, identifying one cyclic reference may require you to spider out the entire dependency graph. This is functionally equivalent to identifying all cyclic references—dixit Dijkstra. Plus, you need to produce sensible, specific error messages. Many "clever" algorithmic tricks fail this test.
Now imagine a spreadsheet API that doesn't allow for any cyclic references ever. This still requires you to validate the entire resulting model, just to determine if 1 change is allowed. It still requires a general validate(Intent). In short, it means your POST and PUT request handlers need to potentially call all your business logic.
That seems overkill, so the usual solution is bespoke validators for every single op. If the business logic changes, there is a risk your API will now accept invalid intent. And the app was not built for that.
If you flip it around and assume intent will go out-of-bounds as a normal matter, then you never have this risk. You can write the validation in one place, and you reuse it for every change as a normal matter of data flow.
Note that this is not cowboy coding. Records and state should not get irreversibly corrupted, because you only ever use valid inputs in computations. If the system is multiplayer, distributed changes should still be well-ordered and/or convergent. But the data structures you're encoding should be, essentially, entirely liberal to your user's needs.
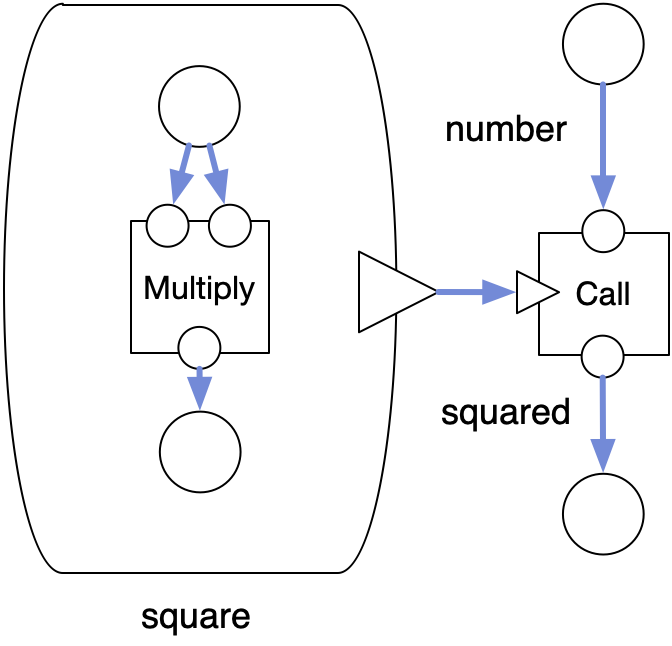
Consider git. Here, a "unit of intent" is just a diff applied to a known revision ID. When something's wrong with a merge, it doesn't crash, or panic, or refuse to work. It just enters a conflict state. This state is computed by merging two incompatible intents.
It's a dirty state that can't be turned into a clean commit without human intervention. This means git must continue to work, because you need to use git to clean it up. So git is fully aware when a conflict is being resolved.
As a general rule, the cases where you actually need to forbid a mutation which satisfies all the type and access constraints are small. A good example is trying to move a folder inside itself: the file system has to remain a sensibly connected tree. Enforcing the uniqueness of names is similar, but also comes with a caution: falsehoods programmers believe about names. Adding (Copy) to a duplicate name is usually better than refusing to accept it, and most names in real life aren't unique at all. Having user-facing names actually requires creating tools and affordances for search, renaming references, resolving duplicates, and so on.
Even among front-end developers, few people actually grok this mental model of a user. It's why most React(-like) apps in the wild are spaghetti, and why most blog posts about React gripes continue to miss the bigger picture. Doing React (and UI) well requires you to unlearn old habits and actually design your types and data flow so it uses potentially invalid input as its single source of truth. That way, a one-way data flow can enforce the necessary constraints on the fly.
The way Stanley likes to encode and mutate his data is how programmers think about their own program: it should be bug-free and not crash. The mistake is to think that this should also apply to any sort of creative process that program is meant to enable. It would be like making an IDE that only allows you to save a file if the code compiles and passes all the tests.

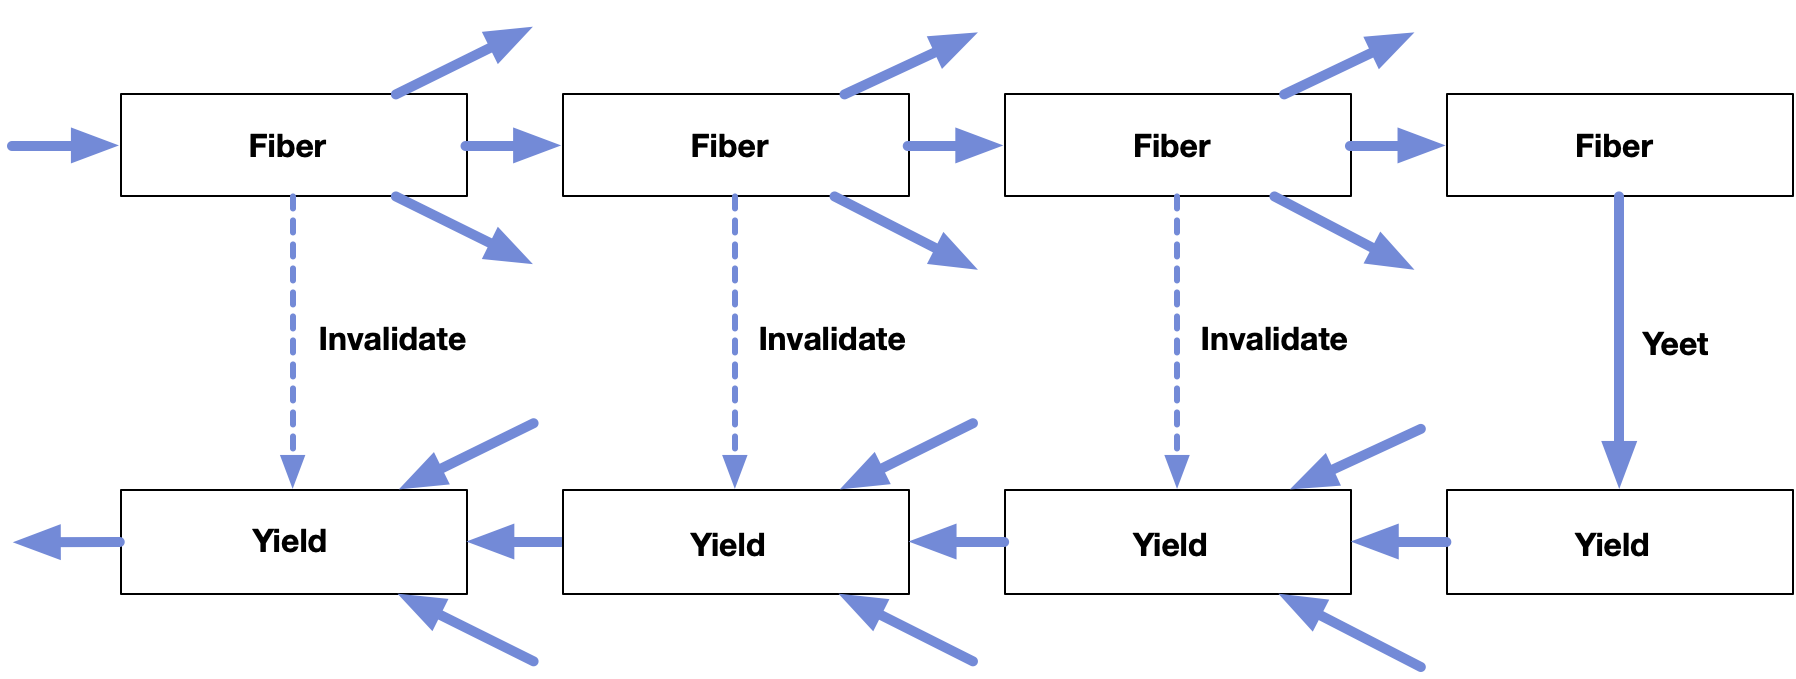
Trigger vs Memo
Coding around intent is a very hard thing to teach, because it can seem overwhelming. But what's overwhelming is not doing this. It leads to codebases where every new feature makes ongoing development harder, because no part of the codebase is ever finished. You will sprinkle copies of your business logic all over the place, in the form of request validation, optimistic local updaters, and guess-based cache invalidation.
If this is your baseline experience, your estimate of what is needed to pull this off will simply be wrong.
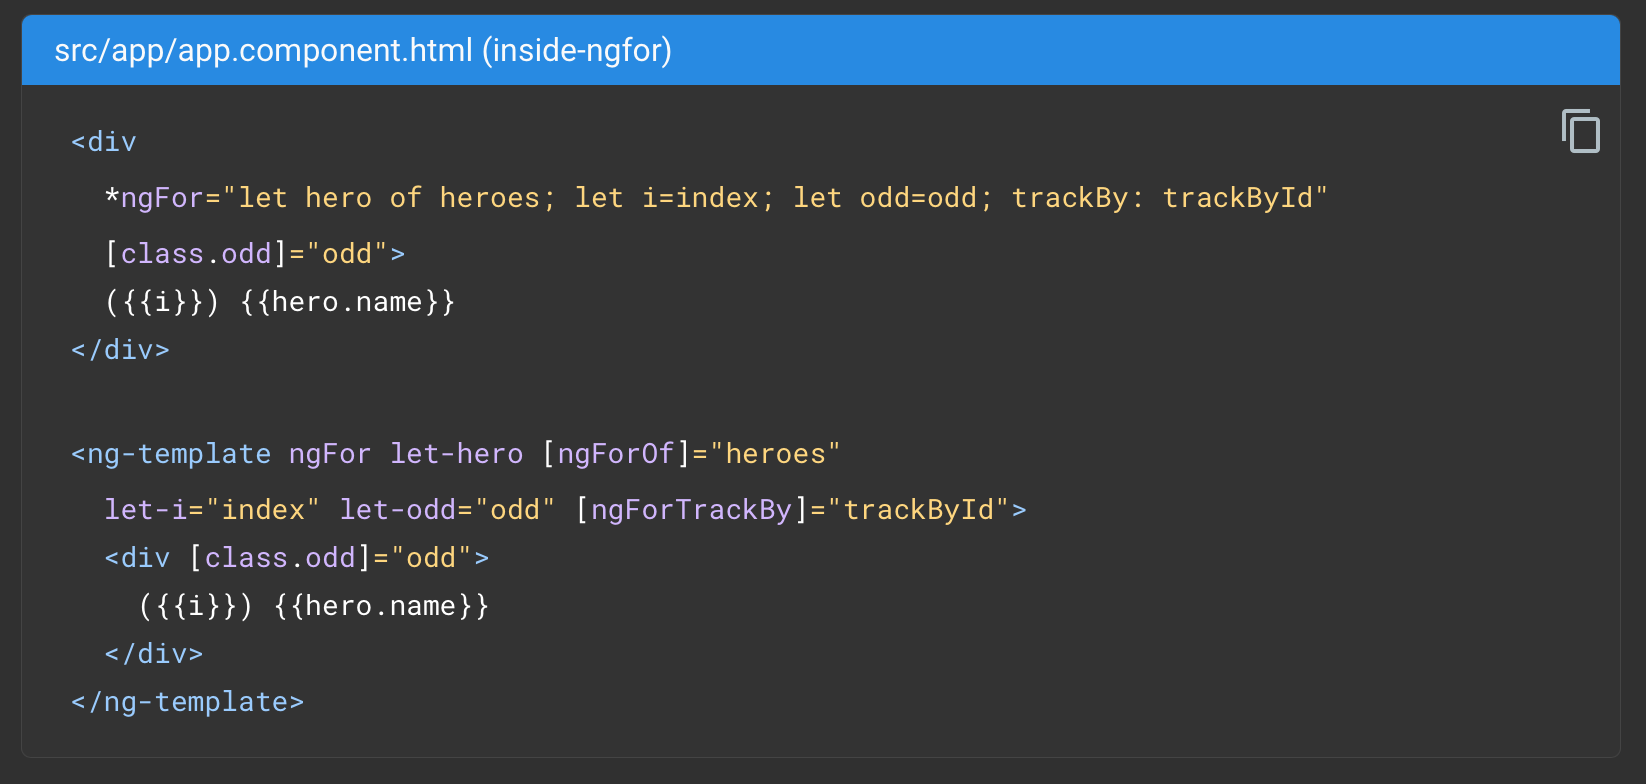
In the traditional MVC model, intent is only handled at the individual input widget or form level. e.g. While typing a number, the intermediate representation is a string. This may be empty, incomplete or not a number, but you temporarily allow that.
I've never seen people formally separate Intent from State in an entire front-end. Often their state is just an adhoc mix of both, where validation constraints are relaxed in the places where it was most needed. They might just duplicate certain fields to keep a validated and unvalidated variant side by side.
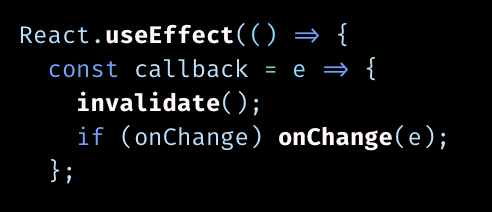
There is one common exception. In a React-like, when you do a useMemo with a derived computation of some state, this is actually a perfect fit. The eponymous useState actually describes Intent, not State, because the derived state is ephemeral. This is why so many devs get lost here.
const state = useMemo(
  () => validate(intent),
  [intent]
);
Their usual instinct is that every action that has knock-on effects should be immediately and fully realized, as part of one transaction. Only, they discover some of those knock-on effects need to be re-evaluated if certain circumstances change. Often to do so, they need to undo and remember what it was before. This is then triggered anew via a bespoke effect, which requires a custom trigger and mutation. If they'd instead deferred the computation, it could have auto-updated itself, and they would've still had the original data to work with.
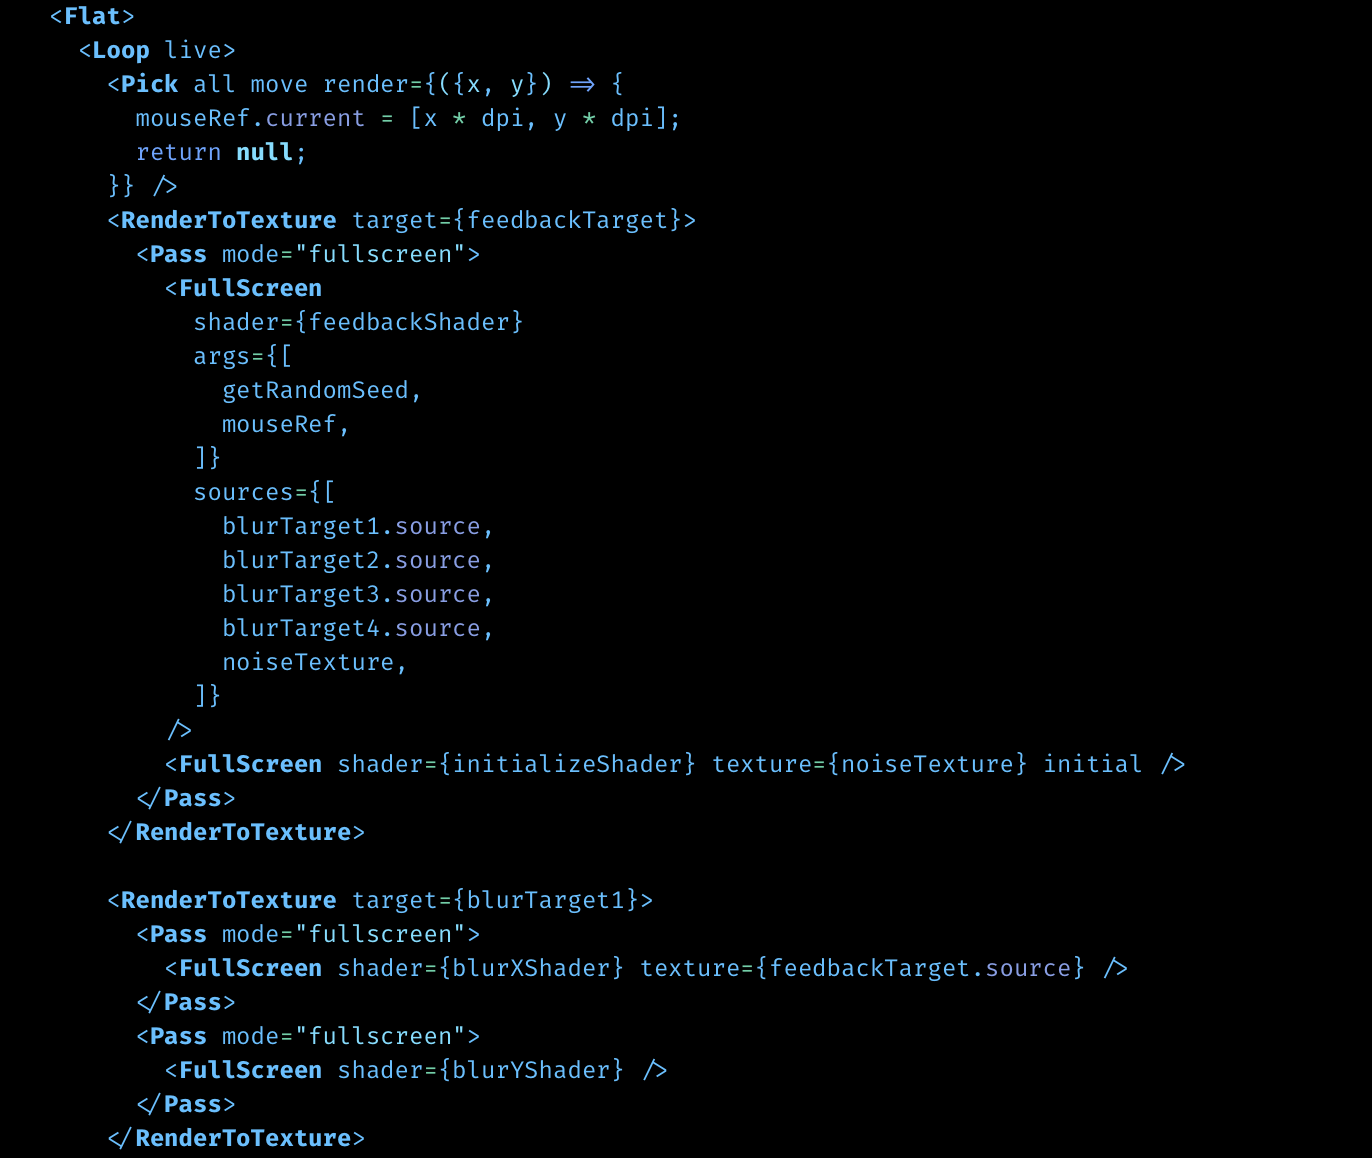
e.g. In a WYSIWYG scenario, you often want to preview an operation as part of mouse hovering or dragging. It should look like the final result. You don't need to implement custom previewing and rewinding code for this. You just need the ability to layer on some additional ephemeral intent on top of the intent that is currently committed. Rewinding just means resetting that extra intent back to empty.
You can make this easy to use by treating previews as a special kind of transaction: now you can make preview states with the same code you use to apply the final change. You can also auto-tag the created objects as being preview-only, which is very useful. That is: you can auto-translate editing intent into preview intent, by messing with the contents of a transaction. Sounds bad, is actually good.
The same applies to any other temporary state, for example, highlighting of elements. Instead of manually changing colors, and creating/deleting labels to pull this off, derive the resolved style just-in-time. This is vastly simpler than doing it all on 1 classic retained model. There, you run the risk of highlights incorrectly becoming sticky, or shapes reverting to the wrong style when un-highlighted. You can architect it so this is simply impossible.
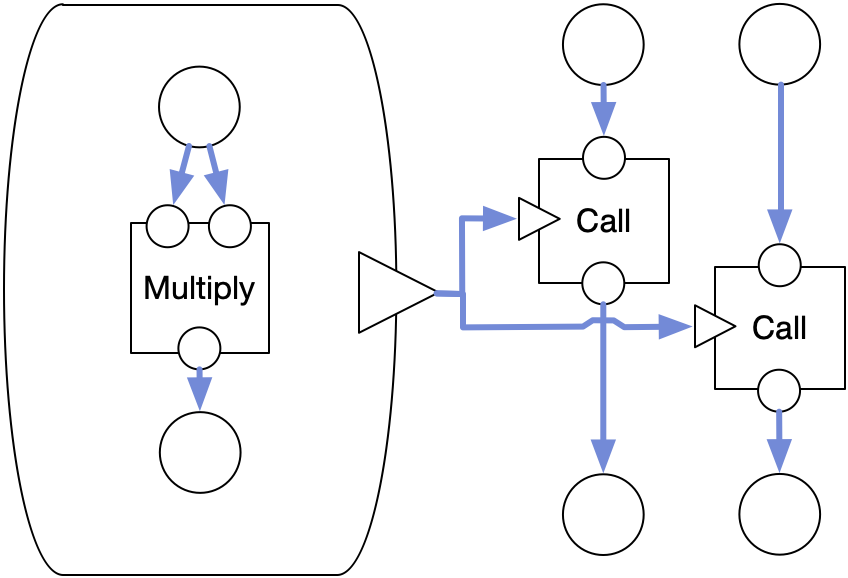
The trigger vs memo problem also happens on the back-end, when you have derived collections. Each object of type A must have an associated type B, created on-demand for each A. What happens if you delete an A? Do you delete the B? Do you turn the B into a tombstone? What if the relationship is 1-to-N, do you need to garbage collect?
If you create invisible objects behind the scenes as a user edits, and you never tell them, expect to see a giant mess as a result. It's crazy how often I've heard engineers suggest a user should only be allowed to create something, but then never delete it, as a "solution" to this problem. Everyday undo/redo precludes it. Don't be ridiculous.
The problem is having an additional layer of bookkeeping you didn't need. The source of truth was collection A, but you created a permanent derived collection B. If you instead make B ephemeral, derived via a stateless computation, then the problem goes away. You can still associate data with B records, but you don't treat B as the authoritative source for itself. This is basically what a WeakMap is.
In database land this can be realized with a materialized view, which can be incremental and subscribed to. Taken to its extreme, this turns into event-based sourcing, which might seem like a panacea for this mindset. But in most cases, the latter is still a system by and for Stanley. The event-based nature of those systems exists to support housekeeping tasks like migration, backup and recovery. Users are not supposed to be aware that this is happening. They do not have any view into the event log, and cannot branch and merge it. The exceptions are extremely rare.
It's not a system for working with user intent, only for flattening it, because it's append-only. It has a lot of the necessary basic building blocks, but substitutes programmer intent for user intent.
What's most nefarious is that the resulting tech stacks are often quite big and intricate, involving job queues, multi-layered caches, distribution networks, and more. It's a bunch of stuff that Stanley can take joy and pride in, far away from users, with "hard" engineering challenges. Unlike all this *ugh* JavaScript, which is always broken and unreliable and uninteresting.
Except it's only needed because Stanley only solved half the problem, badly.
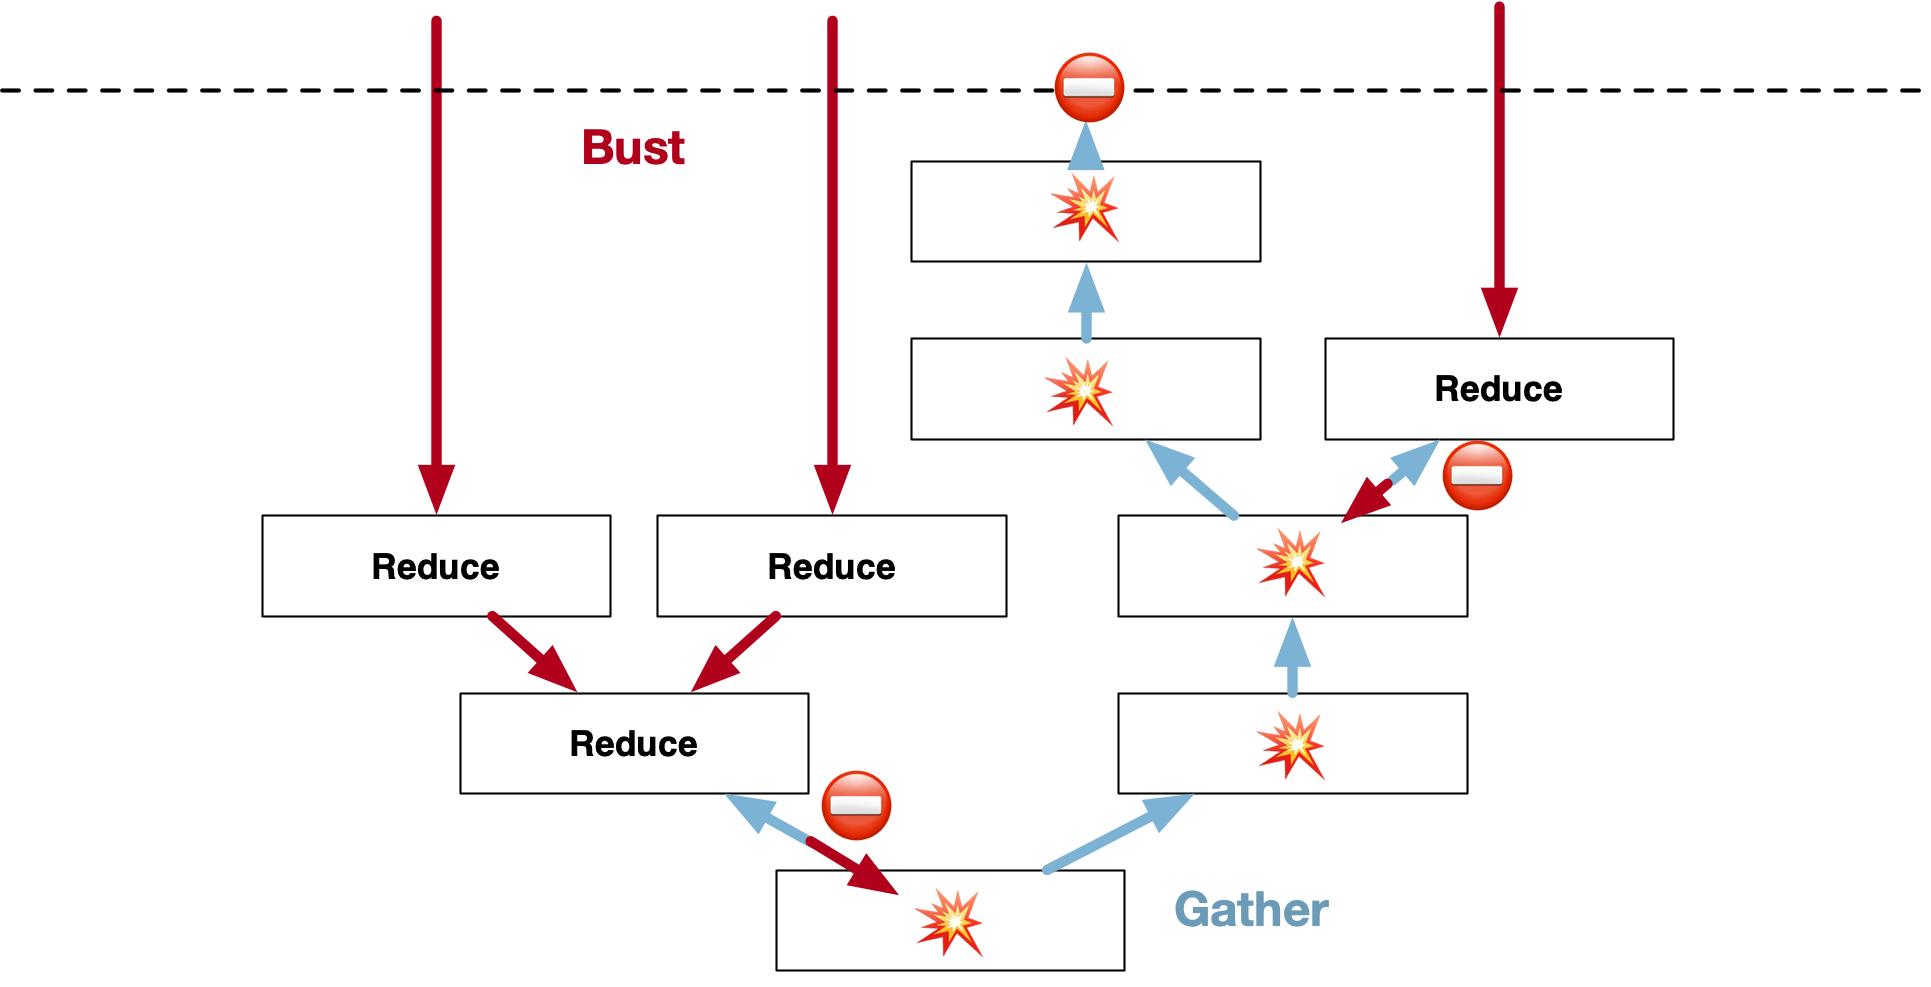
Patch or Bust
When factored in from the start, it's actually quite practical to split Intent from State, and it has lots of benefits. Especially if State is just a more constrained version of the same data structures as Intent. This doesn't need to be fully global either, but it needs to encompass a meaningful document or workspace to be useful.
It does create an additional problem: you now have two kinds of data in circulation. If reading or writing requires you to be aware of both Intent and State, you've made your code more complicated and harder to reason about.
More so, making a new Intent requires a copy of the old Intent, which you mutate or clone. But you want to avoid passing Intent around in general, because it's fishy data. It may have the right types, but the constraints and referential integrity aren't guaranteed. It's a magnet for the kind of bugs a type-checker won't catch.
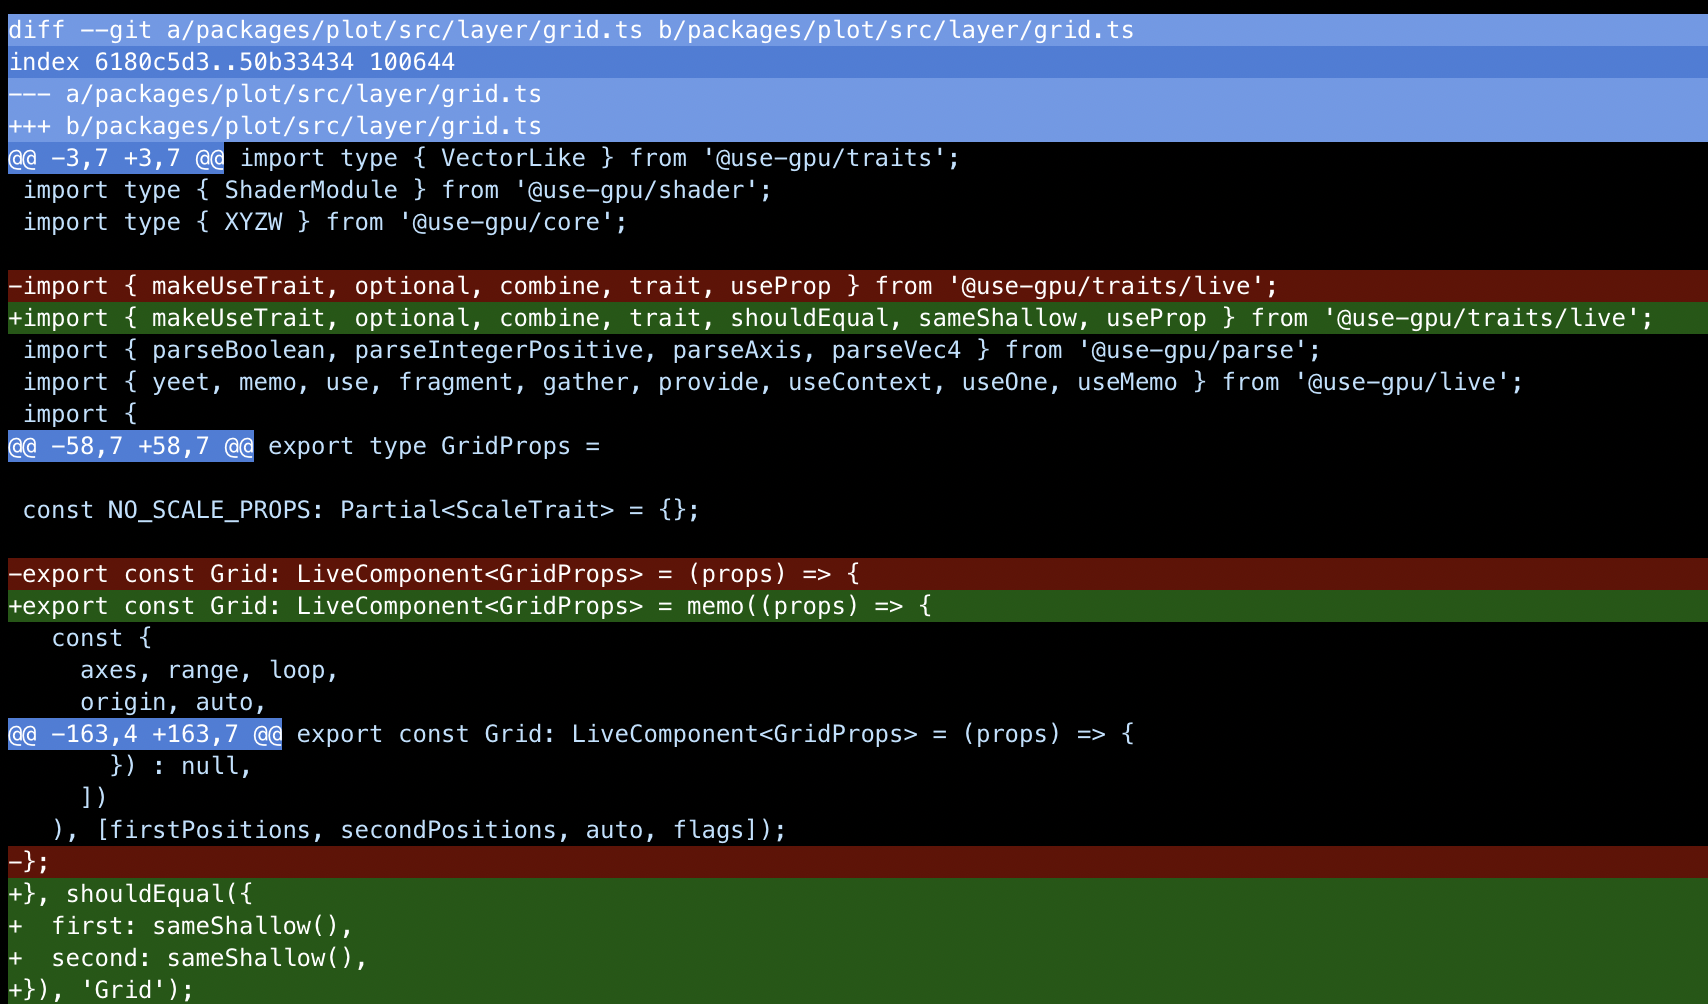
I've published my common solution before: turn changes into first-class values, and make a generic update of type Update<T> be the basic unit of change. As a first approximation, consider a shallow merge {...value, ...update}. This allows you to make an updateIntent(update) function where update only specifies the fields that are changing.
In other words, Update<Intent> looks just like Update<State> and can be derived 100% from State, without Intent. Only one place needs to have access to the old Intent, all other code can just call that. You can make an app intent-aware without complicating all the code.
If your state is cleaved along orthogonal lines, then this is all you need. i.e. If column and line are two separate fields, then you can selectively change only one of them. If they are stored as an XY tuple or vector, now you need to be able to describe a change that only affects either the X or Y component.
const value = {
  hello: 'text',
  foo: { bar: 2, baz: 4 },
};

const update = {
  hello: 'world',
  foo: { baz: 50 },
};

expect(
  patch(value, update)
).toEqual({
  hello: 'world',
  foo: { bar: 2, baz: 50 },
});
So in practice I have a function patch(value, update) which implements a comprehensive superset of a deep recursive merge, with full immutability. It doesn't try to do anything fancy with arrays or strings, they're just treated as atomic values. But it allows for precise overriding of merging behavior at every level, as well as custom lambda-based updates. You can patch tuples by index, but this is risky for dynamic lists. So instead you can express e.g. "append item to list" without the entire list, as a lambda.
I've been using patch for years now, and the uses are myriad. To overlay a set of overrides onto a base template, patch(base, overrides) is all you need. It's the most effective way I know to erase a metric ton of {...splats} and ?? defaultValues and != null from entire swathes of code. This is a real problem.
You could also view this as a "poor man's OT", with the main distinction being that a patch update only describes the new state, not the old state. Such updates are not reversible on their own. But they are far simpler to make and apply.
It can still power a global undo/redo system, in combination with its complement diff(A, B): you can reverse an update by diffing in the opposite direction. This is an operation which is formalized and streamlined into revise(…), so that it retains the exact shape of the original update, and doesn't require B at all. The structure of the update is sufficient information: it too encodes some intent behind the change.
With patch you also have a natural way to work with changes and conflicts as values. The earlier WYSIWIG scenario is just patch(commited, ephemeral) with bells on.
The net result is that mutating my intent or state is as easy as doing a {...value, ...update} splat, but I'm not falsely incentivized to flatten my data structures.
Instead it frees you up to think about what the most practical schema actually is from the data's point of view. This is driven by how the user wishes to edit it, because that's what you will connect it to. It makes you think about what a user's workspace actually is, and lets you align boundaries in UX and process with boundaries in data structure.

Remember: most classic "data structures" are not about the structure of data at all. They serve as acceleration tools to speed up specific operations you need on that data. Having the reads and writes drive the data design was always part of the job. What's weird is that people don't apply that idea end-to-end, from database to UI and back.
SQL tables are shaped the way they are because it enables complex filters and joins. However, I find this pretty counterproductive: it produces derived query results that are difficult to keep up to date on a client. They also don't look like any of the data structures I actually want to use in my code.
A Bike Shed of Schemas
This points to a very under-appreciated problem: it is completely pointless to argue about schemas and data types without citing specific domain logic and code that will be used to produce, edit and consume it. Because that code determines which structures you are incentivized to use, and which structures will require bespoke extra work.
From afar, column and line are just XY coordinates. Just use a 2-vector. But once you factor in the domain logic and etiquette, you realize that the horizontal and vertical directions have vastly different rules applied to them, and splitting might be better. Which one do you pick?
This applies to all data. Whether you should put items in a List<T> or a Map<K, V> largely depends on whether the consuming code will loop over it, or need random access. If an API only provides one, consumers will just build the missing Map or List as a first step. This is O(n log n) either way, because of sorting.
The method you use to read or write your data shouldn't limit use of everyday structure. Not unless you have a very good reason. But this is exactly what happens.
A lot of bad choices in data design come down to picking the "wrong" data type simply because the most appropriate one is inconvenient in some cases. This then leads to Conway's law, where one team picks the types that are most convenient only for them. The other teams are stuck with it, and end up writing bidirectional conversion code around their part, which will never be removed. The software will now always have this shape, reflecting which concerns were considered essential. What color are your types?
{
  order: [4, 11, 9, 5, 15, 43],
  values: {
    4: {...},
    5: {...},
    9: {...},
    11: {...},
    15: {...},
    43: {...},
  },
);
For List vs Map, you can have this particular cake and eat it too. Just provide a List<Id> for the order and a Map<Id, T> for the values. If you structure a list or tree this way, then you can do both iteration and ID-based traversal in the most natural and efficient way. Don't underestimate how convenient this can be.
This also has the benefit that "re-ordering items" and "editing items" are fully orthogonal operations. It decomposes the problem of "patching a list of objects" into "patching a list of IDs" and "patching N separate objects". It makes code for manipulating lists and trees universal. It lets you to decide on a case by case basis whether you need to garbage collect the map, or whether preserving unused records is actually desirable.
Limiting it to ordinary JSON or JS types, rather than going full-blown OT or CRDT, is a useful baseline. With sensible schema design, at ordinary editing rates, CRDTs are overkill compared to the ability to just replay edits, or notify conflicts. This only requires version numbers and retries.
Users need those things anyway: just because a CRDT converges when two people edit, doesn't mean the result is what either person wants. The only case where OTs/CRDTs are absolutely necessary is rich-text editing, and you need bespoke UI solutions for that anyway. For simple text fields, last-write-wins is perfectly fine, and also far superior to what 99% of RESTy APIs do.
A CRDT is just a mechanism that translates partially ordered intents into a single state. Like, it's cool that you can make CRDT counters and CRDT lists and whatnot... but each CRDT implements only one particular resolution strategy. If it doesn't produce the desired result, you've created invalid intent no user expected. With last-write-wins, you at least have something 1 user did intend. Whether this is actually destructive or corrective is mostly a matter of schema design and minimal surface area, not math.
The main thing that OTs and CRDTs do well is resolve edits on ordered sequences, like strings. If two users are typing text in the same doc, edits higher-up will shift edits down below, which means the indices change when rebased. But if you are editing structured data, you can avoid referring to indices entirely, and just use IDs instead. This sidesteps the issue, like splitting order from values.
For the order, there is a simple solution: a map with a fractional index, effectively a dead-simple list CRDT. It just comes with some overhead.
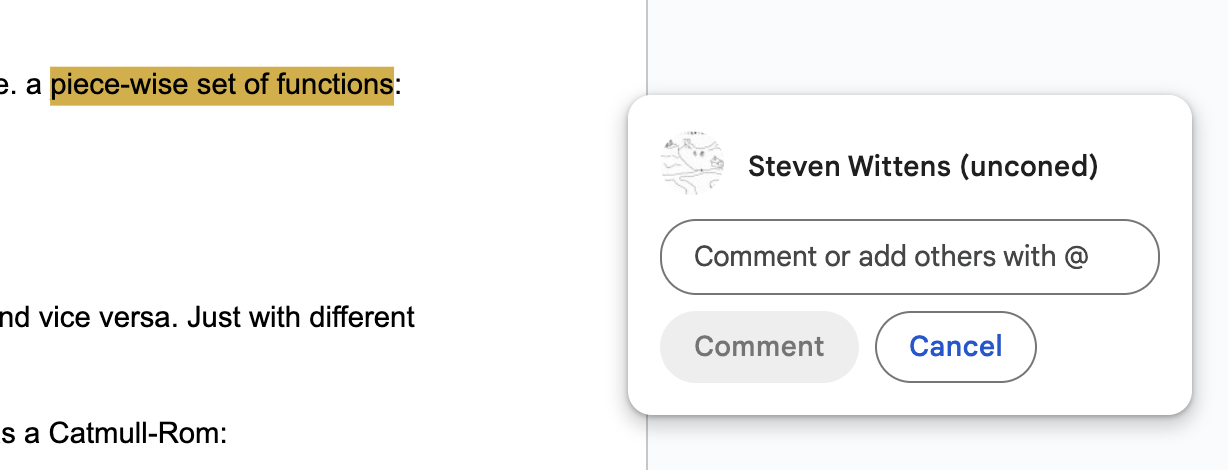
Using a CRDT for string editing might not even be enough. Consider Google Docs-style comments anchored to that text: their indices also need to shift on every edit. Now you need a bespoke domain-aware CRDT. Or you work around it by injecting magic markers into the text. Either way, it seems non-trivial to decouple a CRDT from the specific target domain of the data inside. The constraints get mixed in.
If you ask me, this is why the field of real-time web apps is still in somewhat of a rut. It's mainly viewed as a high-end technical problem: how do we synchronize data structures over a P2P network without any data conflicts? What they should be asking is: what is the minimal amount of structure we need to reliably synchronize, so that users can have a shared workspace where intent is preserved, and conflicts are clearly signposted. And how should we design our schemas, so that our code can manipulate the data in a straightforward and reliable way? Fixing non-trivial user conflicts is simply not your job.
Most SaaS out there doesn't need any of this technical complexity. Consider that a good multiplayer app requires user presence and broadcast anyway. The simplest solution is just a persistent process on a single server coordinating this, one per live workspace. It's what most MMOs do. In fast-paced video games, this even involves lag compensation. Reliable ordering is not the big problem.
The situations where this doesn't scale, or where you absolutely must be P2P, are a minority. If you run into them, you must be doing very well. The solution that I've sketched out here is explicitly designed so it can comfortably be done by small teams, or even just 1 person.
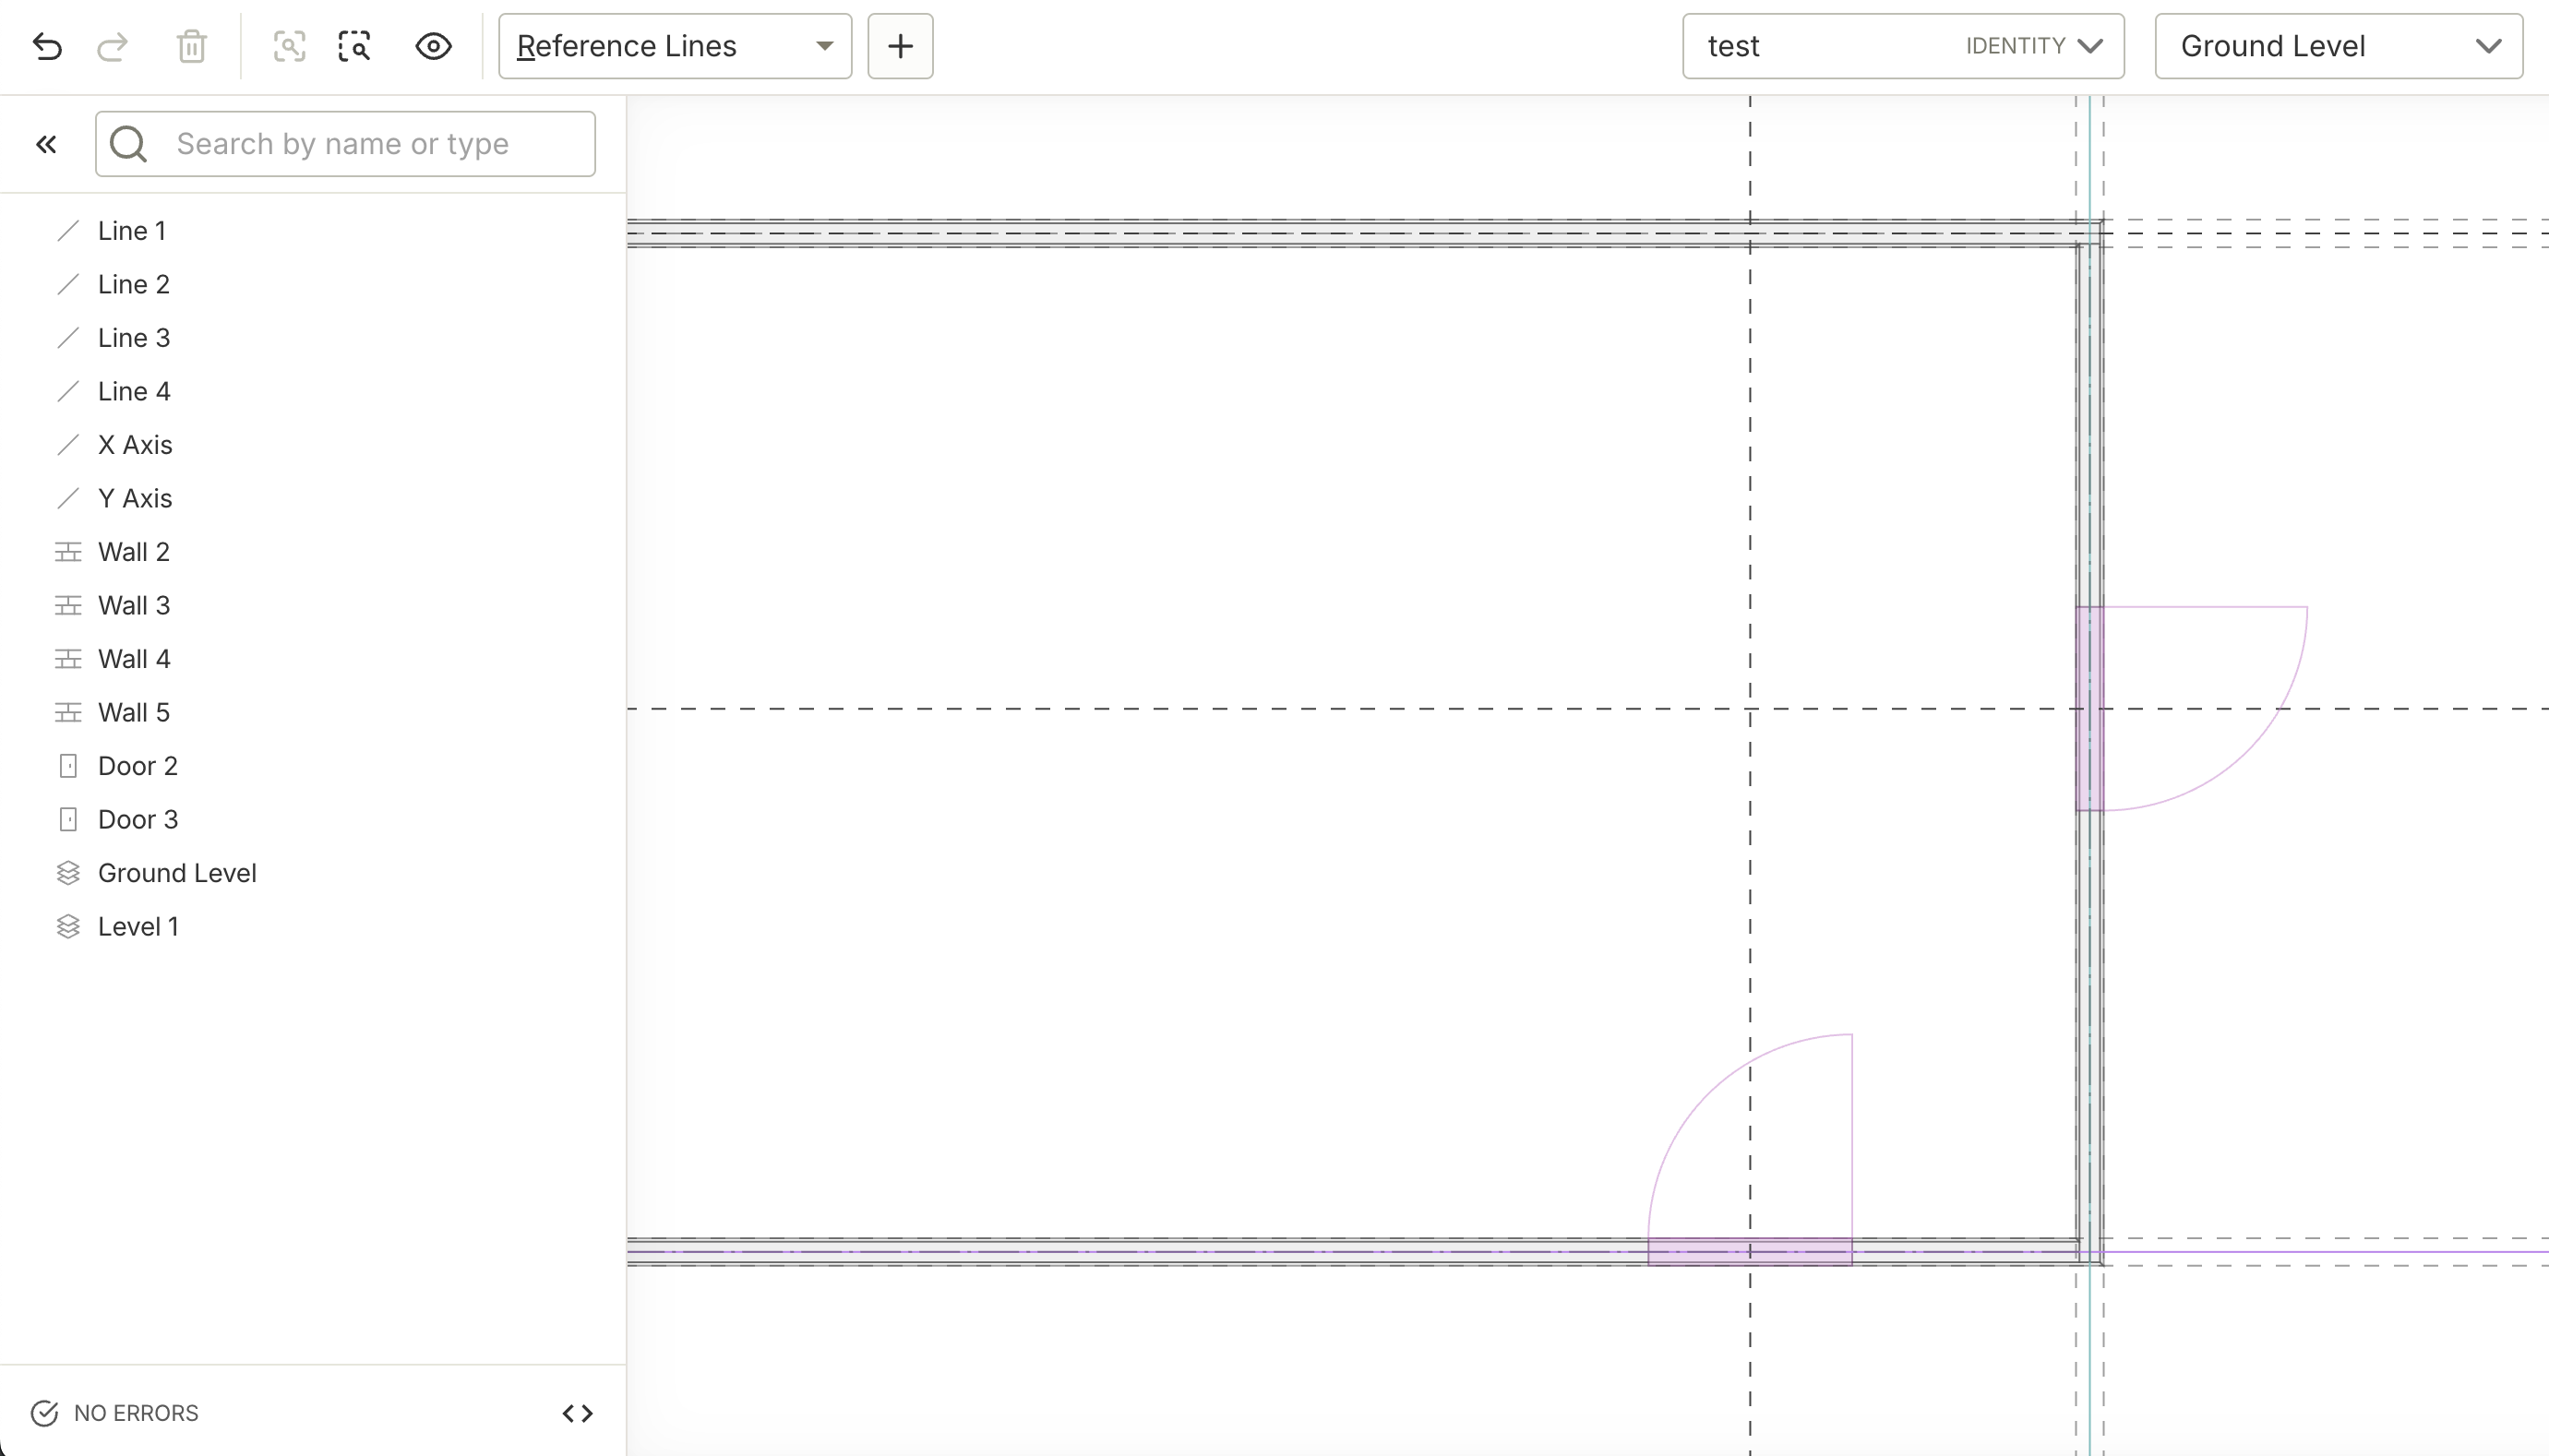
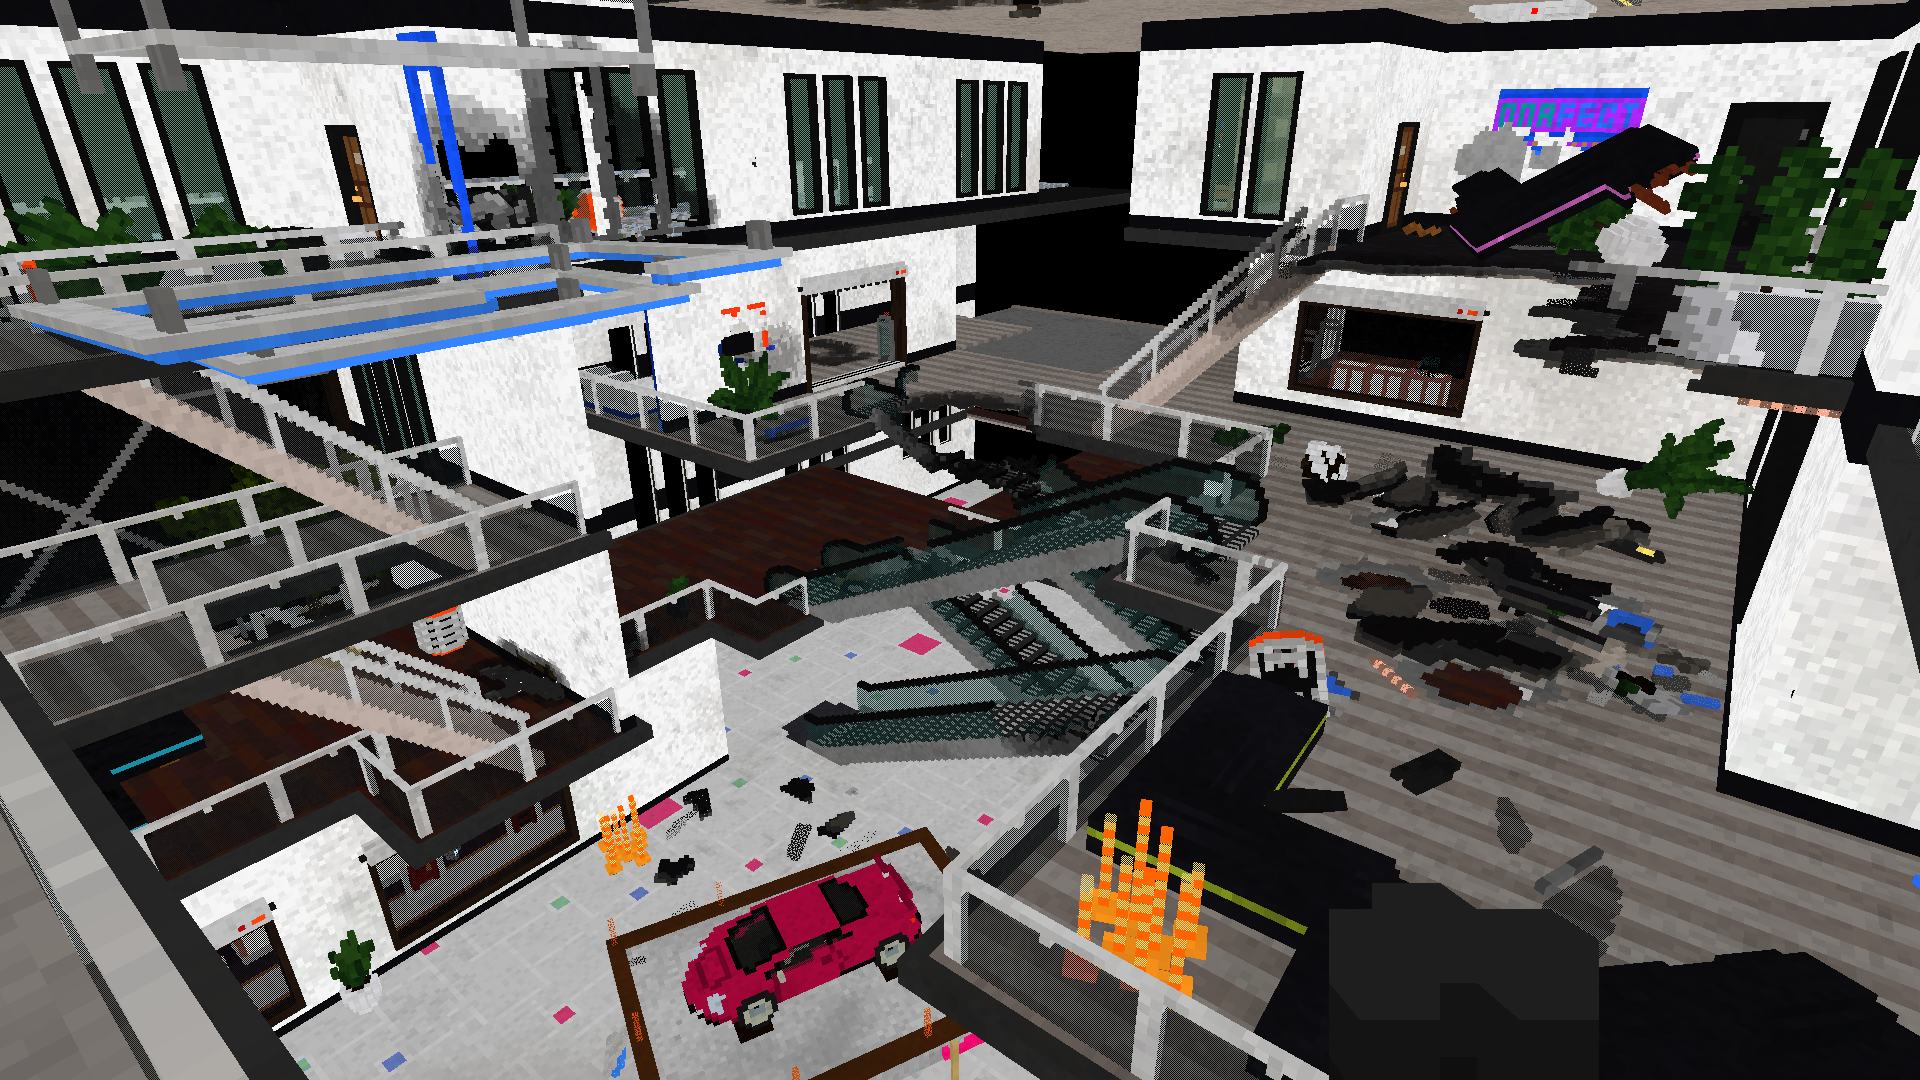
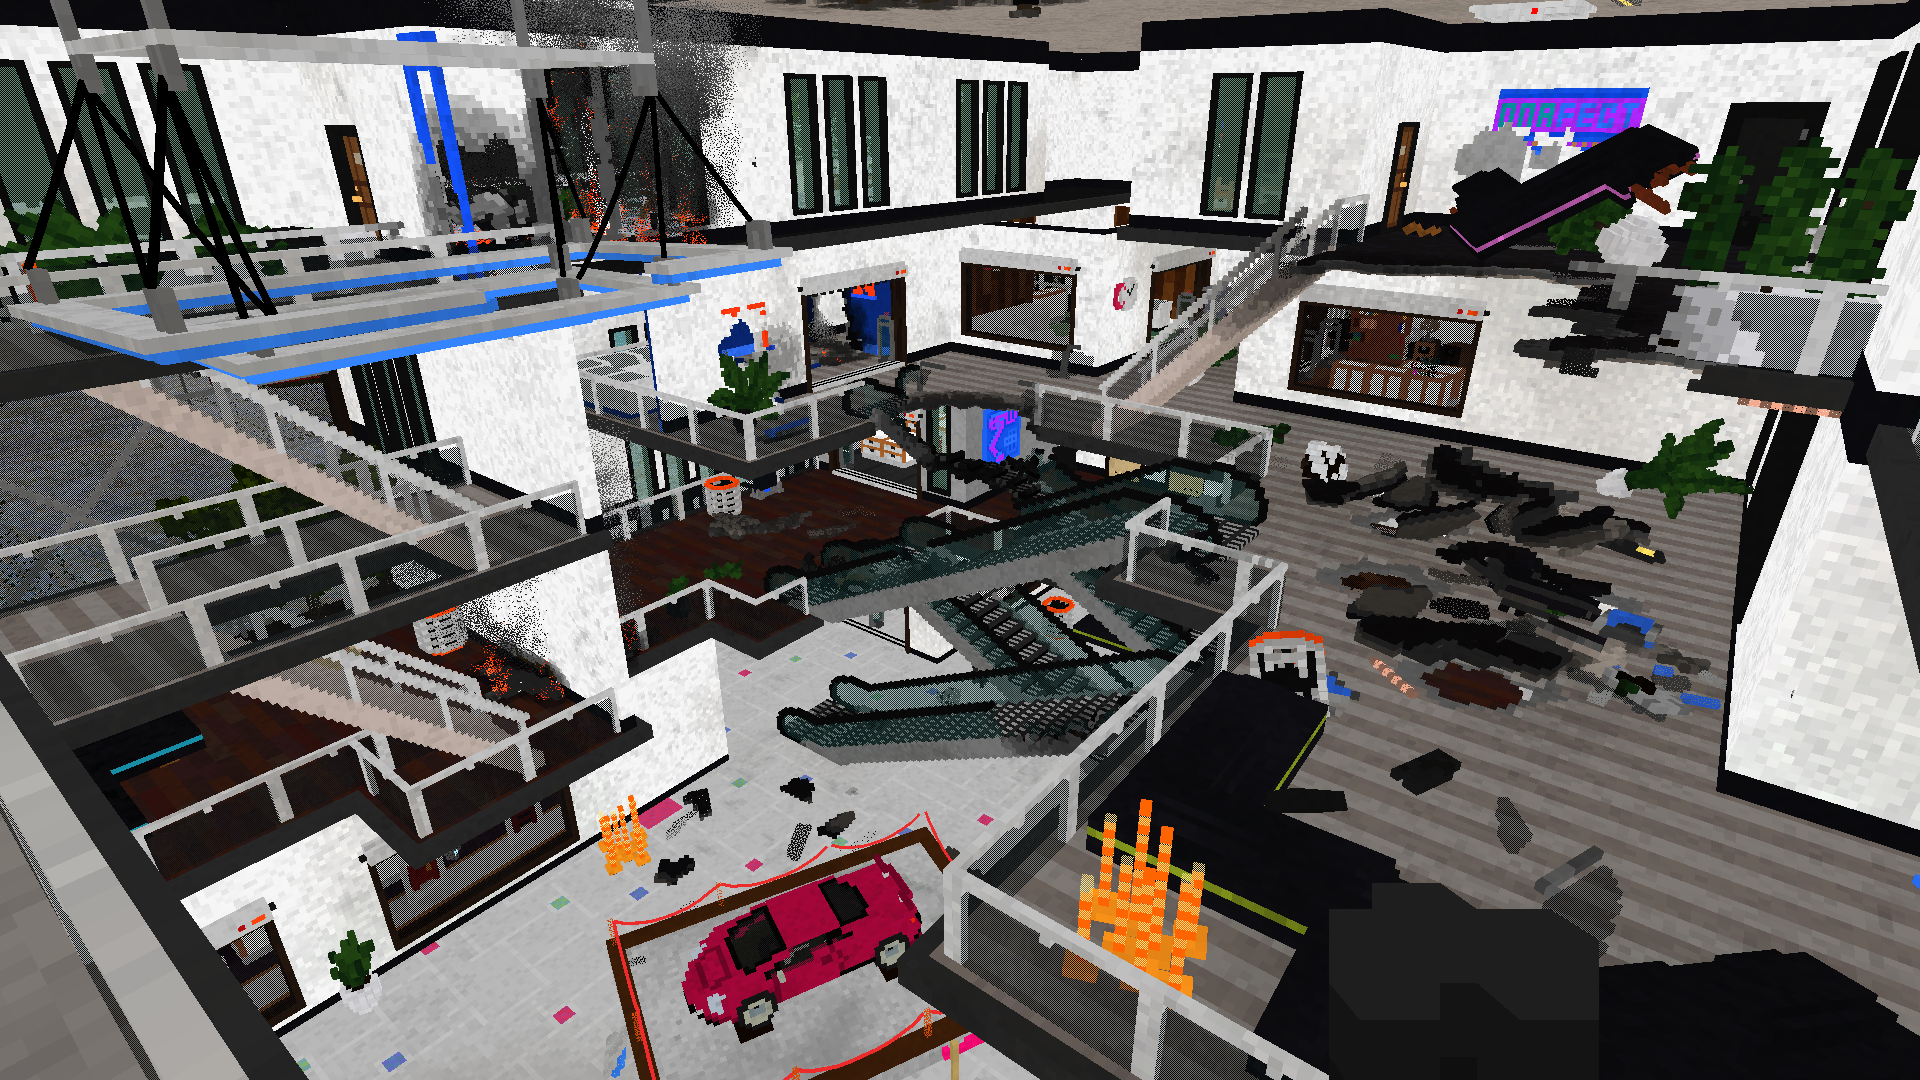
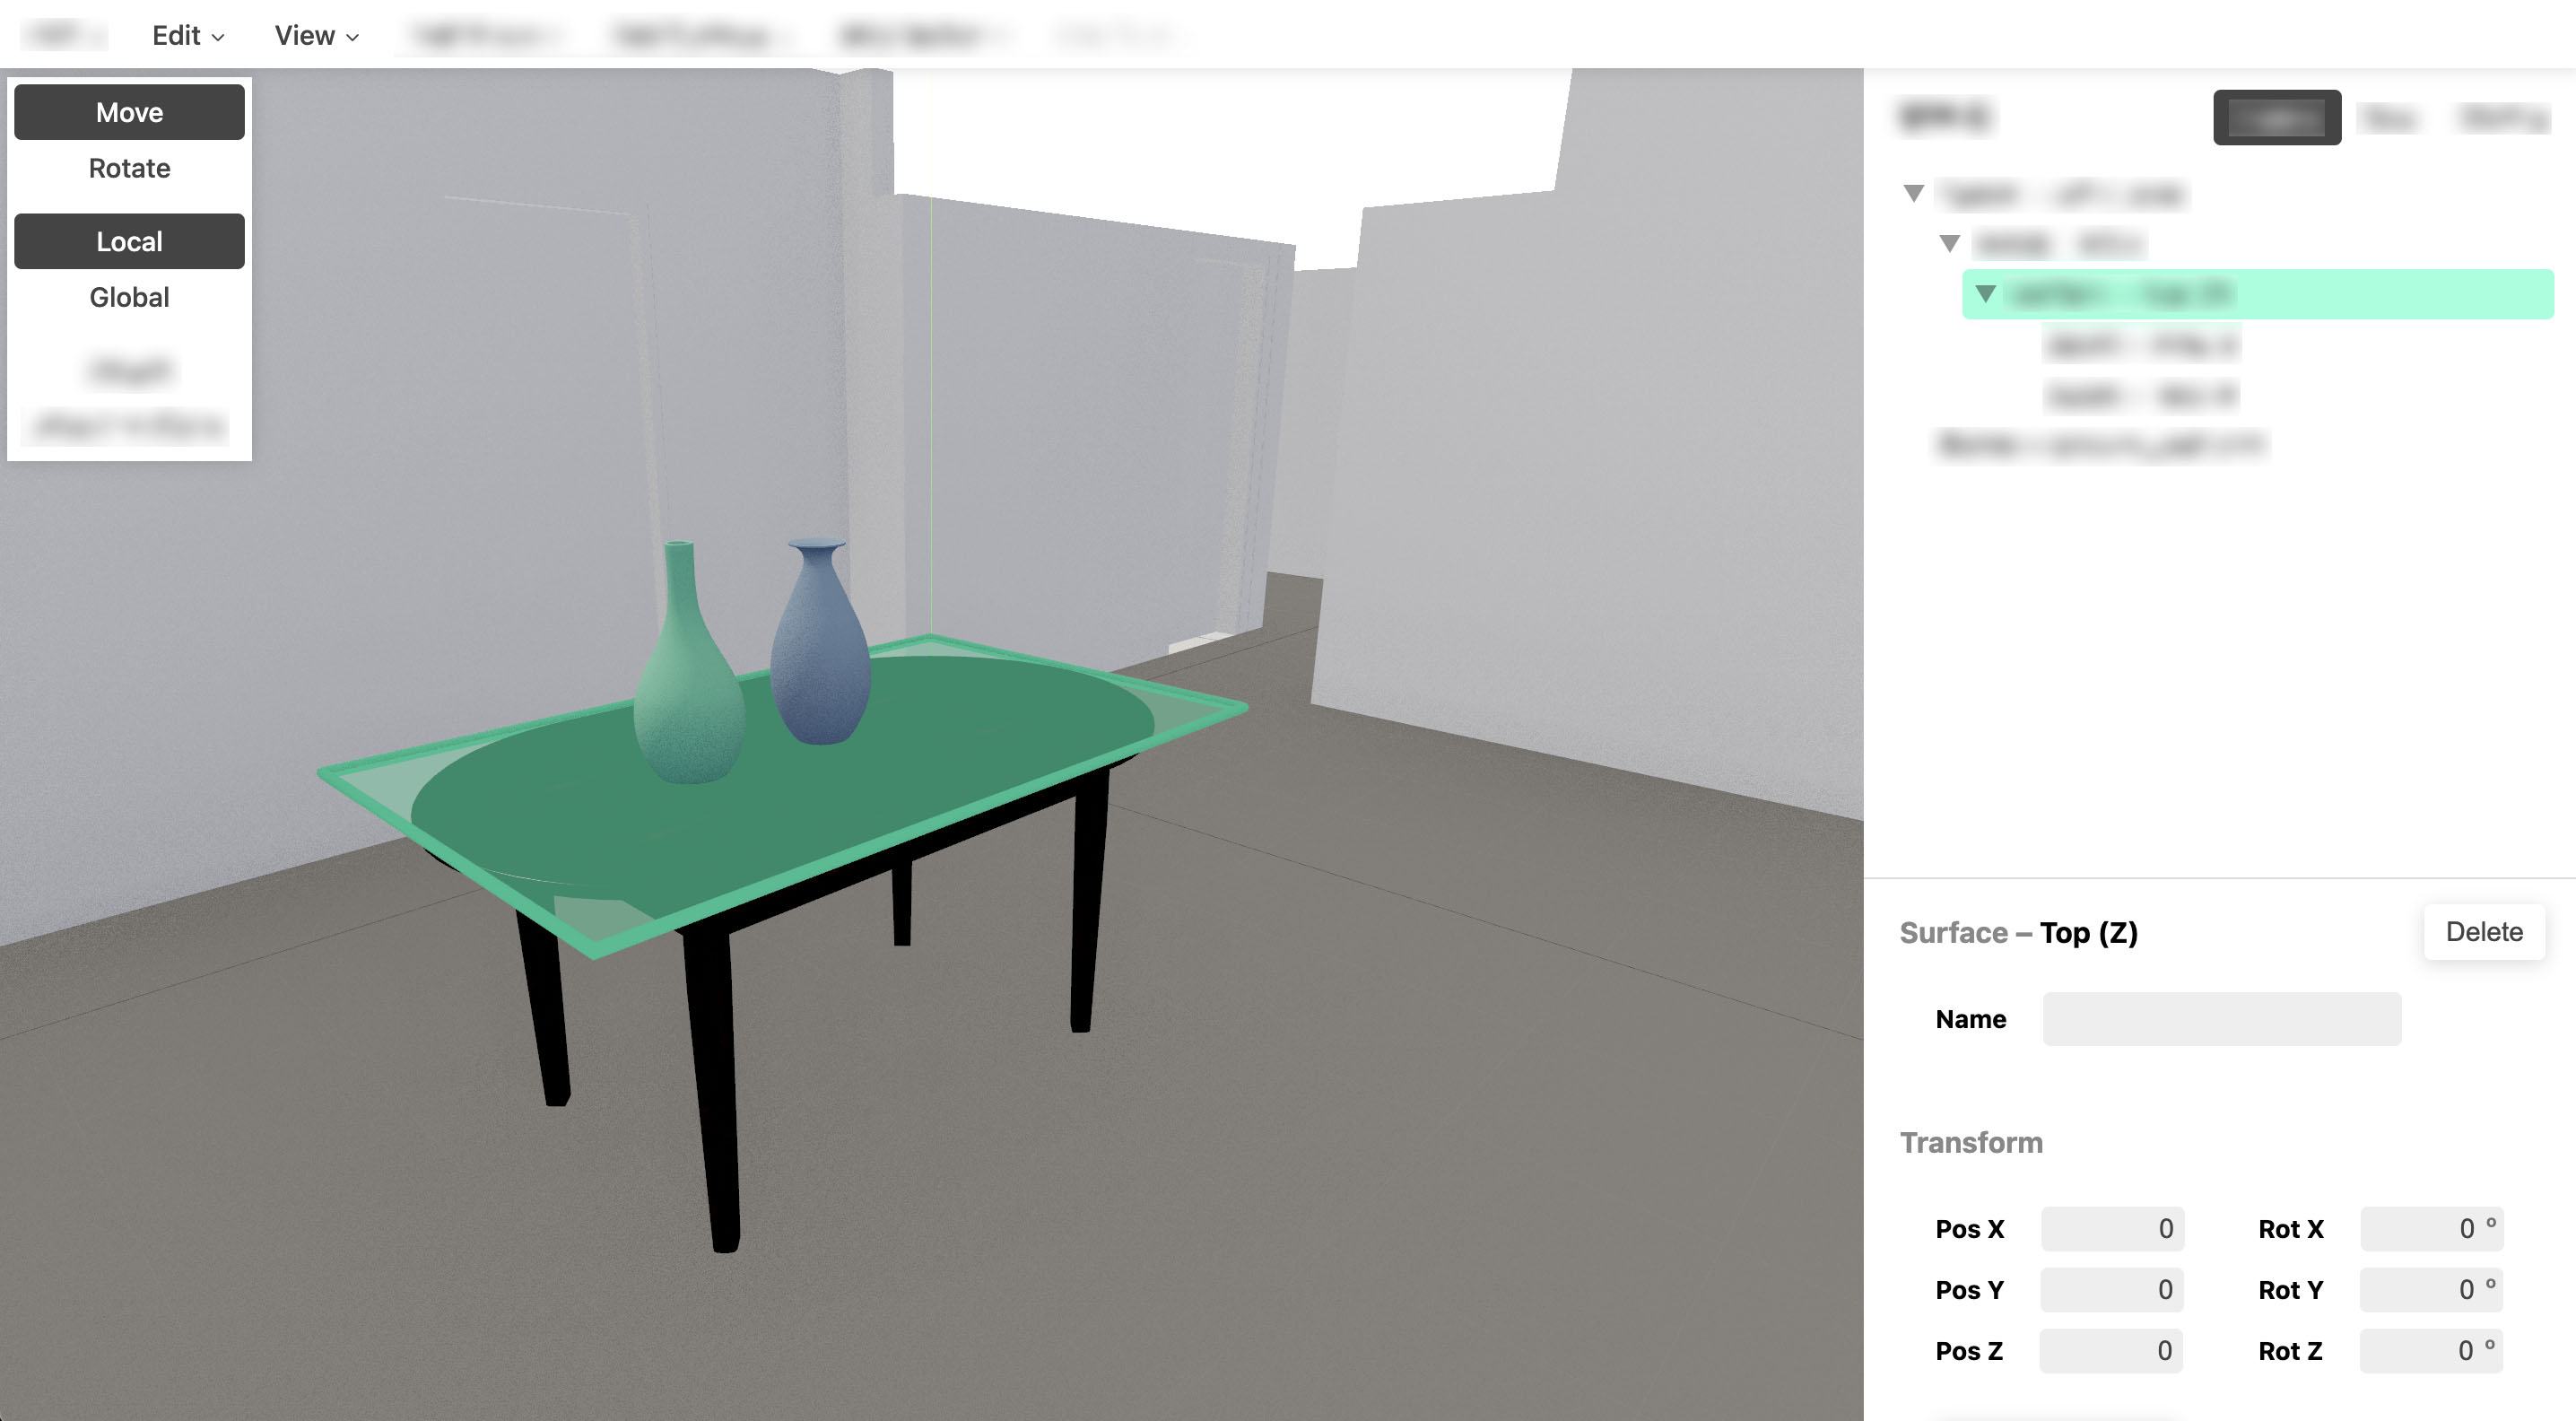
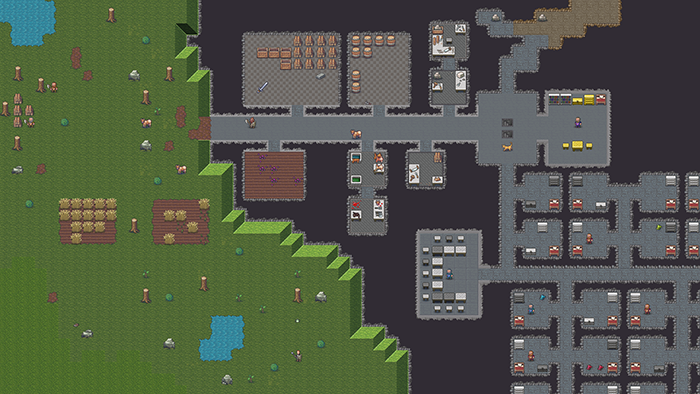
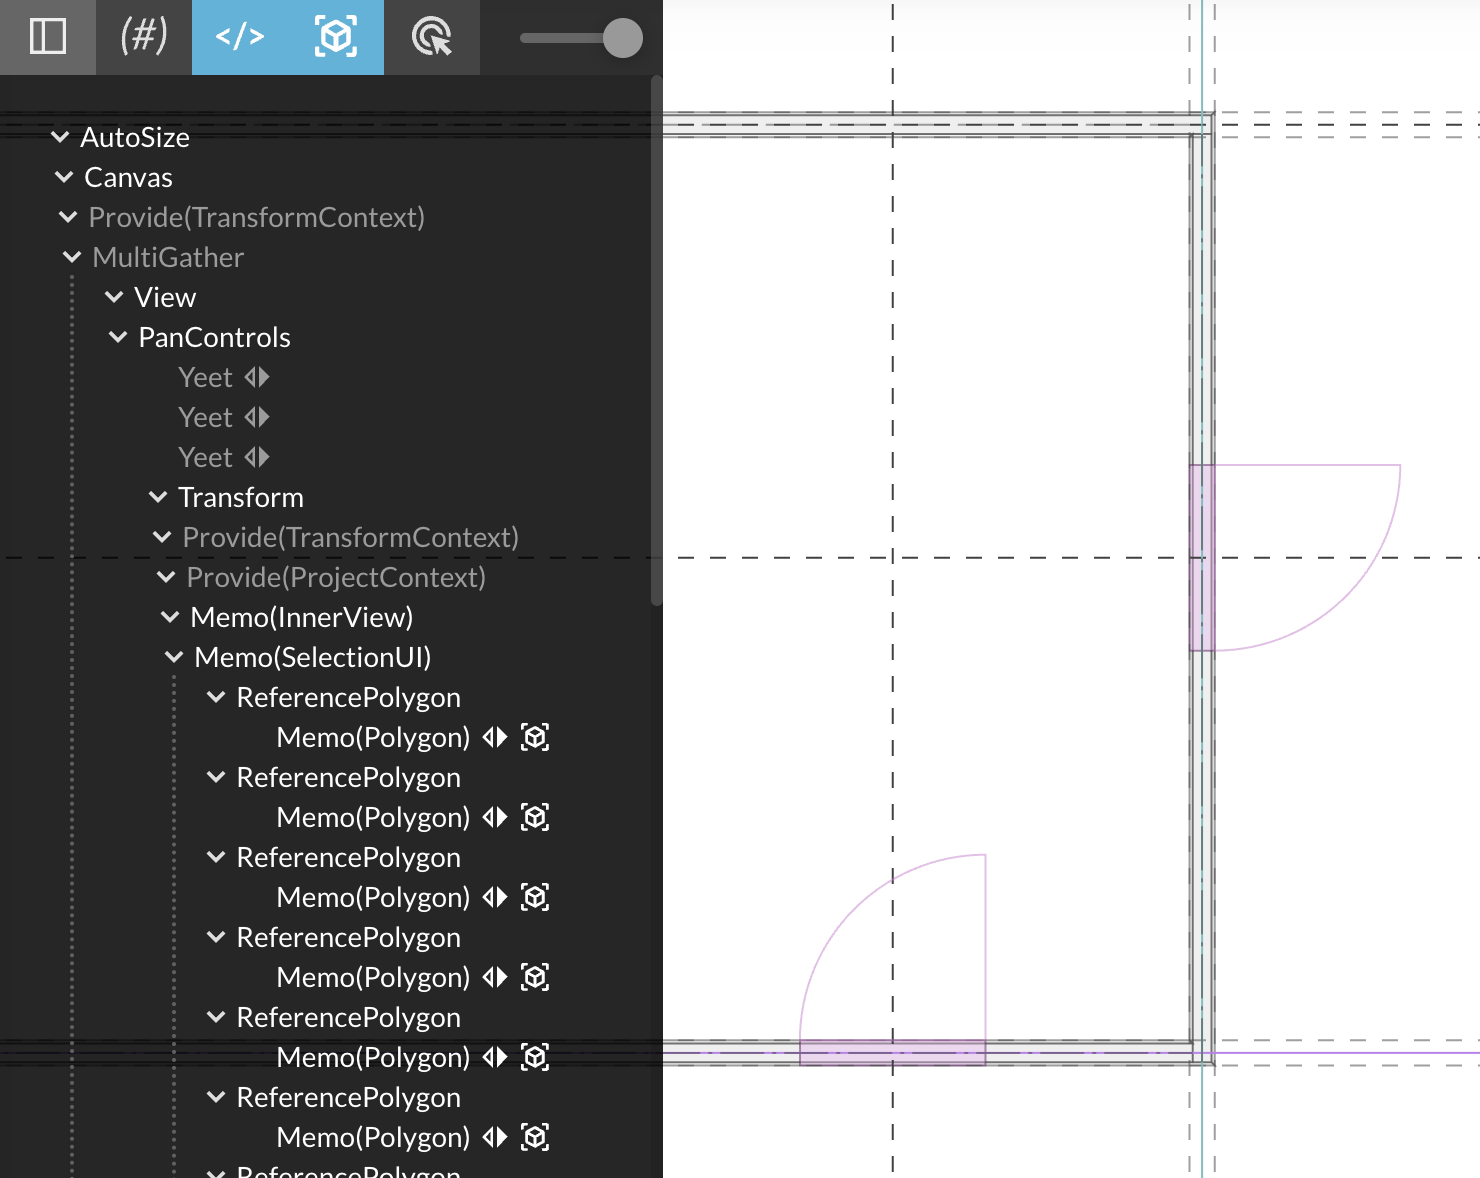
The (private) CAD app I showed glimpses of above is entirely built this way. It's patch all the way down and it's had undo/redo from day 1. It also has a developer mode where you can just edit the user-space part of the data model, and save/load it.
When the in-house designers come to me with new UX requests, they often ask: "Is it possible to do ____?" The answer is never a laborious sigh from a front-end dev with too much on their plate. It's "sure, and we can do more."
If you're not actively aware the design of schemas and code is tightly coupled, your codebase will explode, and the bulk of it will be glue. Much of it just serves to translate generalized intent into concrete state or commands. Arguments about schemas are usually just hidden debates about whose job it is to translate, split or join something. This isn't just an irrelevant matter of "wire formats" because changing the structure and format of data also changes how you address specific parts of it.
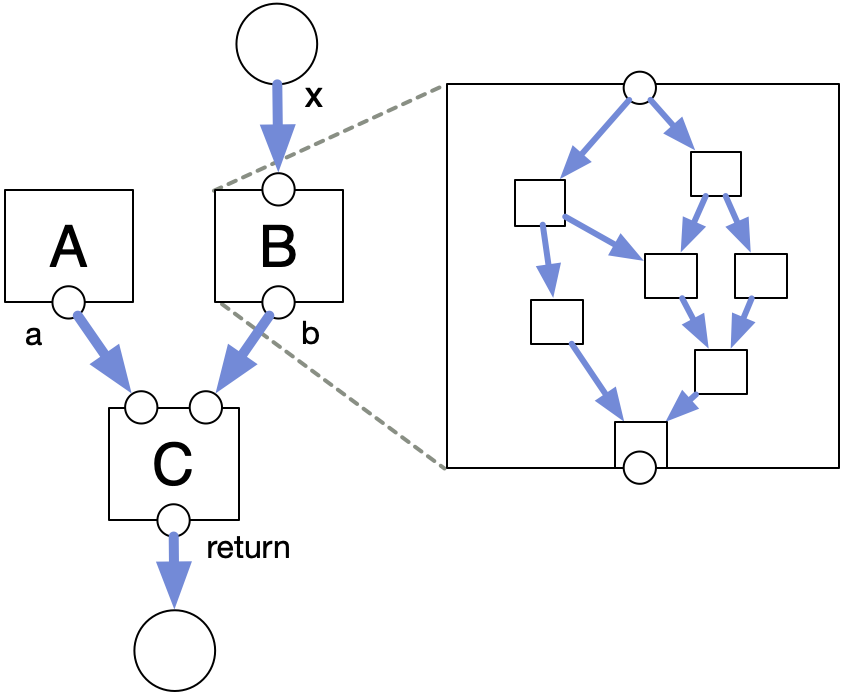
In an interactive UI, you also need a reverse path, to apply edits. What I hope you are starting to realize is that this is really just the forward path in reverse, on so many levels. The result of a basic query is just the ordered IDs of the records that it matched. A join returns a tuple of record IDs per row. If you pre-assemble the associated record data for me, you actually make my job as a front-end dev harder, because there are multiple forward paths for the exact same data, in subtly different forms. What I want is to query and mutate the same damn store you do, and be told when what changes. It's table-stakes now.
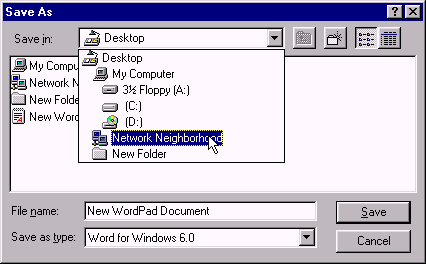
With well-architected data, this can be wired up mostly automatically, without any scaffolding. The implementations you encounter in the wild just obfuscate this, because they don't distinguish between the data store and the model it holds. The fact that the data store should not be corruptible, and should enforce permissions and quotas, is incorrectly extended to the entire model stored inside. But that model doesn't belong to Stanley, it belongs to the user. This is why desktop applications didn't have a "Data Export". It was just called Load and Save, and what you saved was the intent, in a file.
Having a universal query or update mechanism doesn't absolve you from thinking about this either, which is why I think the patch approach is so rare: it looks like cowboy coding if you don't have the right boundaries in place. Patch is mainly for user-space mutations, not kernel-space, a concept that applies to more than just OS kernels. User-space must be very forgiving.
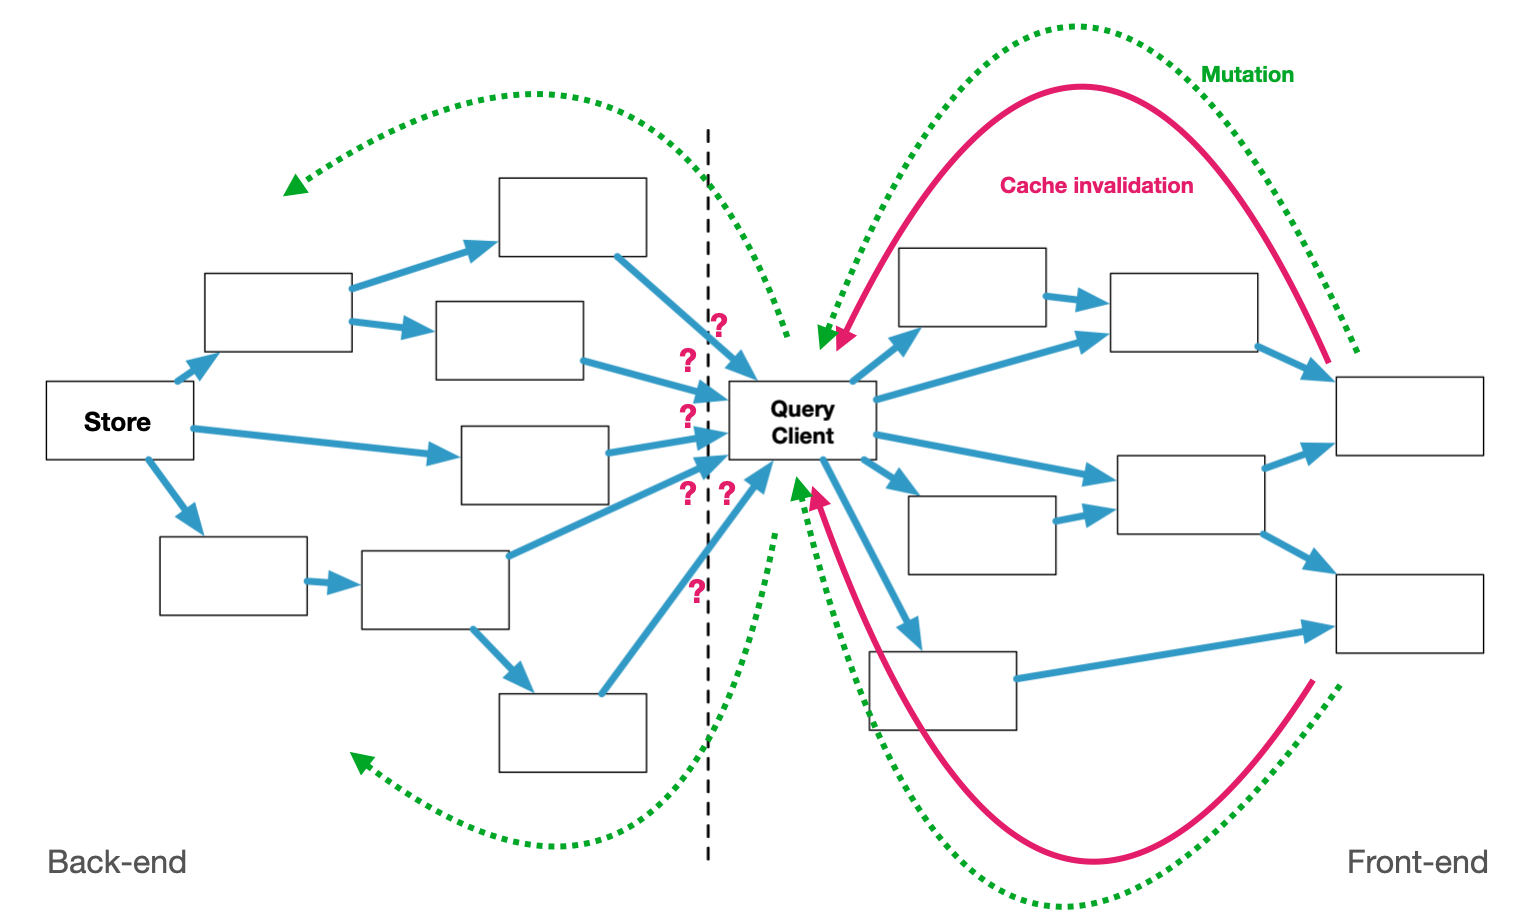
If you avoid it, you end up with something like GraphQL, a good example of solving only half the problem badly. Its getter assembles data for consumption by laboriously repeating it in dozens of partial variations. And it turns the setter part into an unsavory mix of lasagna and spaghetti. No wonder, it was designed for a platform that owns and hoards all your data.
* * *
Viewed narrowly, Intent is just a useful concept to rethink how you enforce validation and constraints in a front-end app. Viewed broadly, it completely changes how you build back-ends and data flows to support that. It will also teach you how adding new aspects to your software can reduce complexity, not increase it, if done right.
A good metric is to judge implementation choices by how many other places of the code need to care about them. If a proposed change requires adjustments literally everywhere else, it's probably a bad idea, unless the net effect is to remove code rather than add.
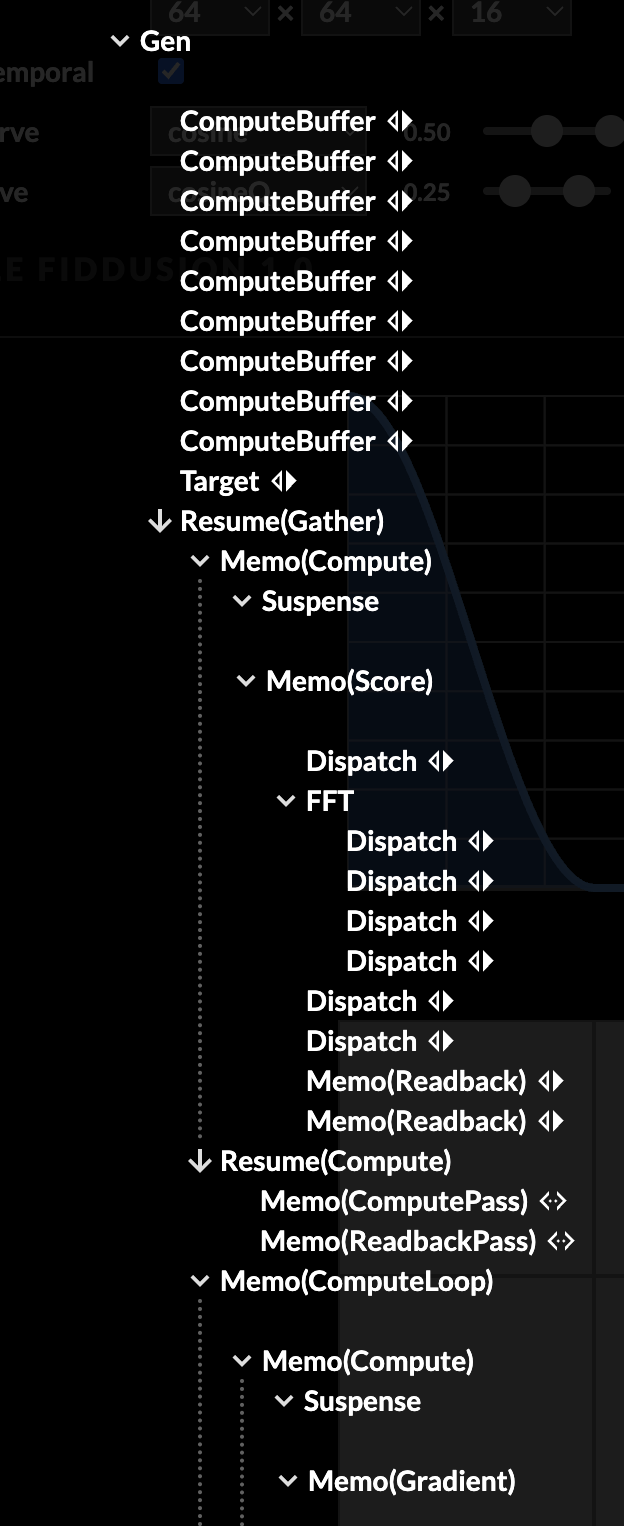
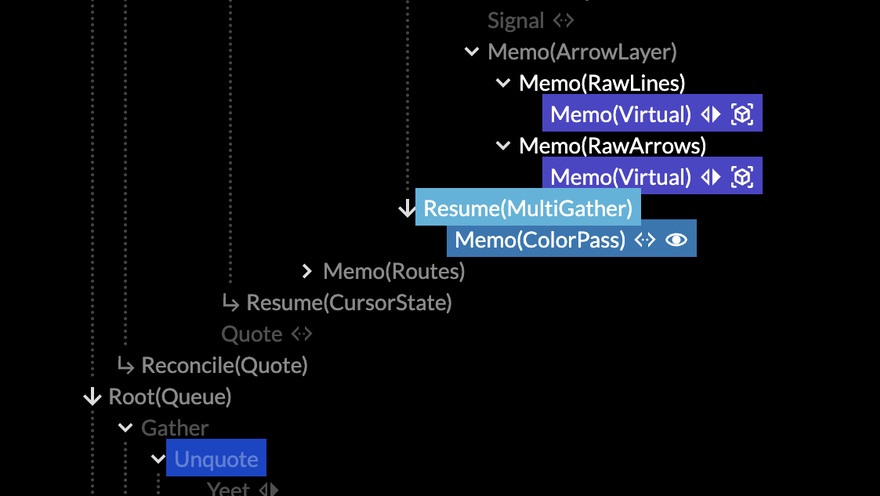
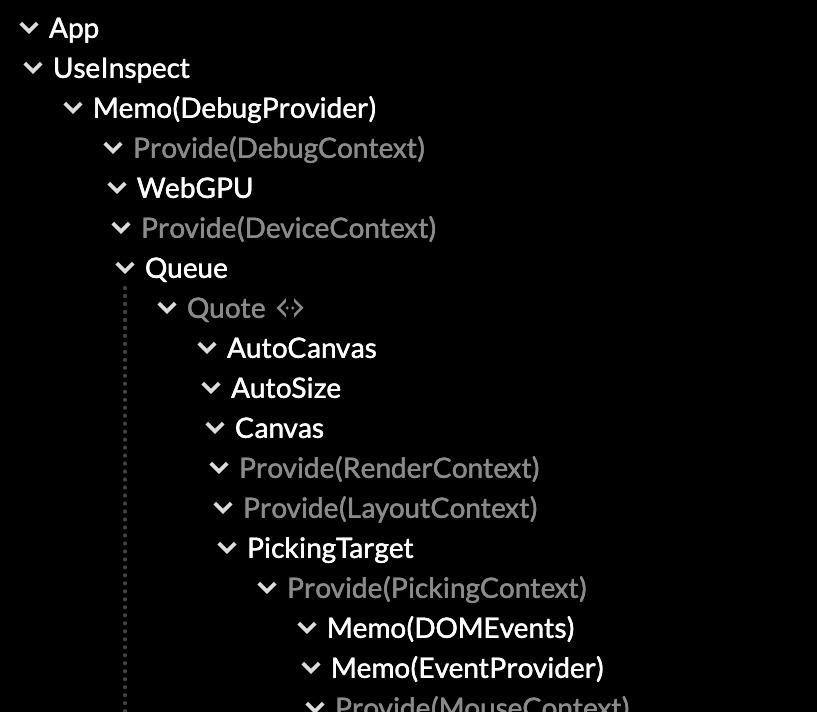
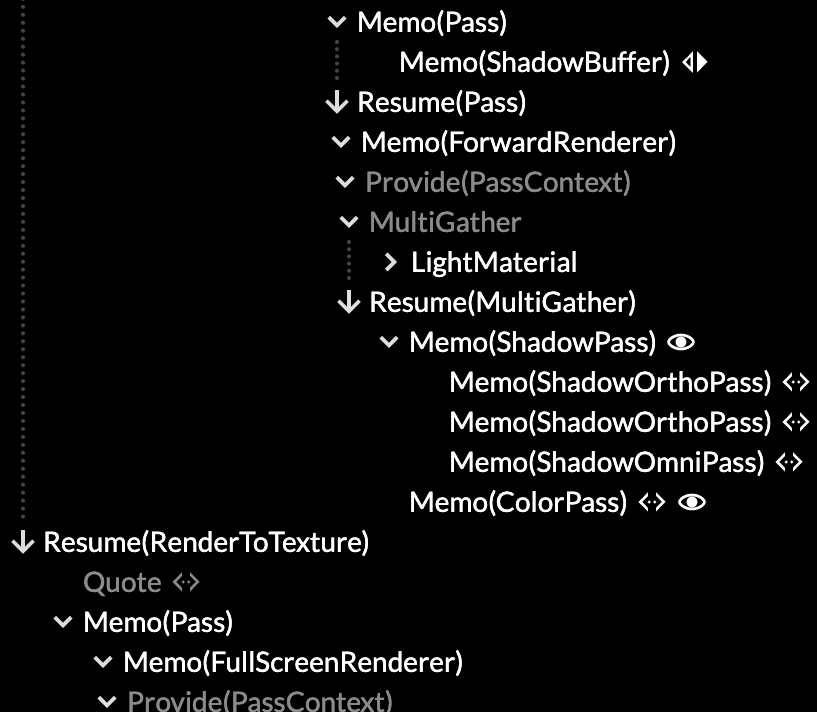
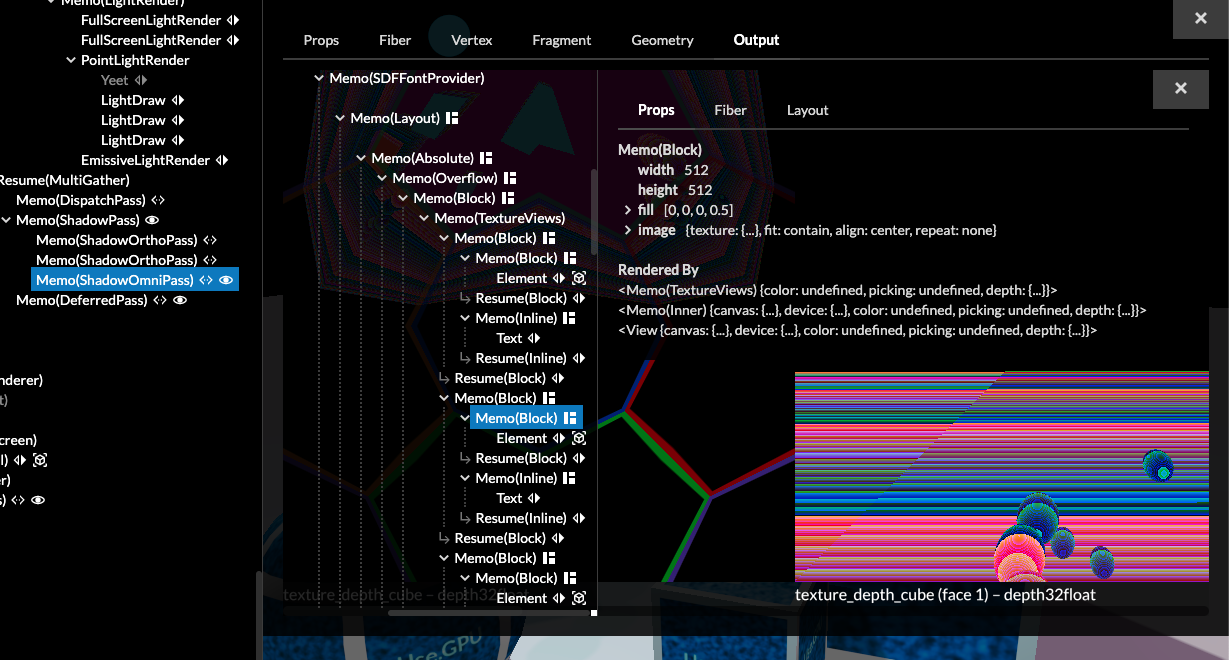
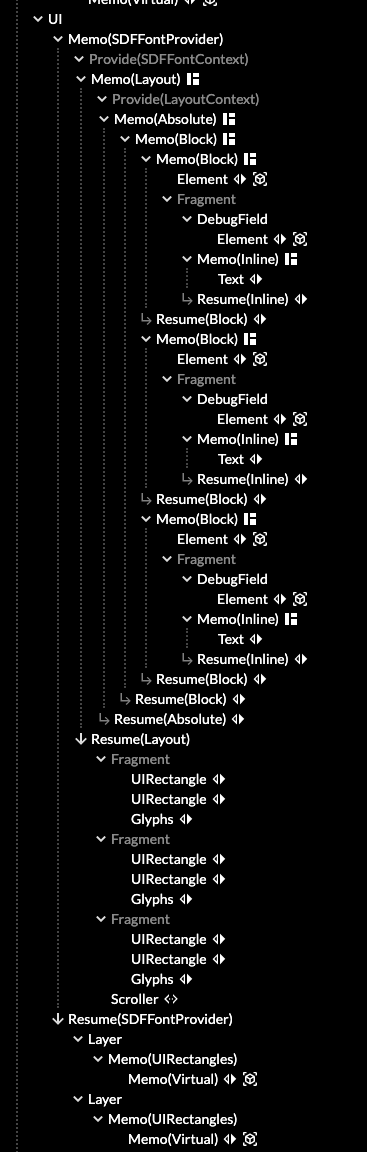
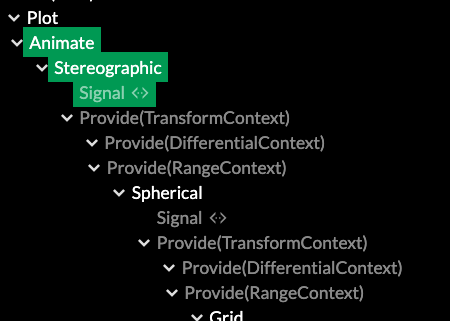
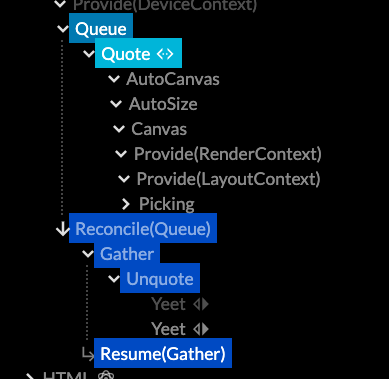
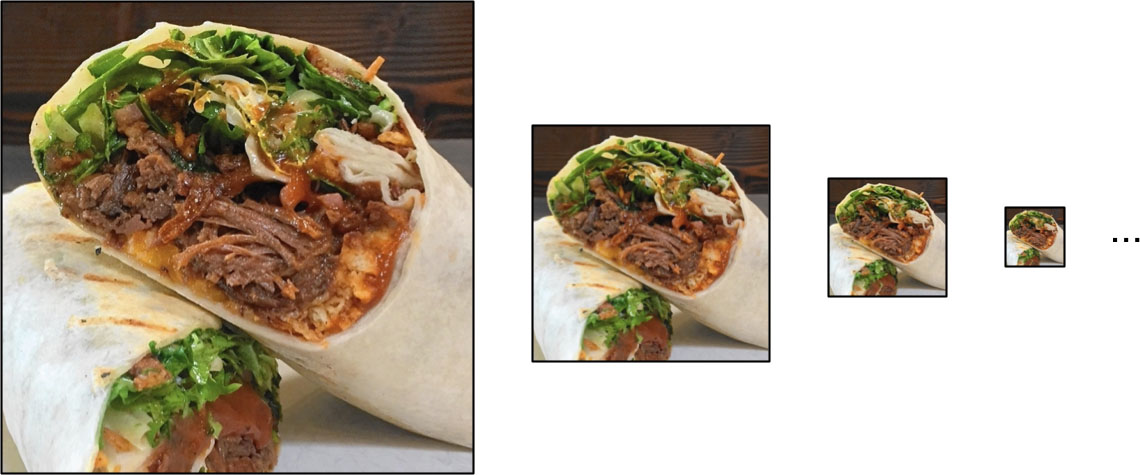
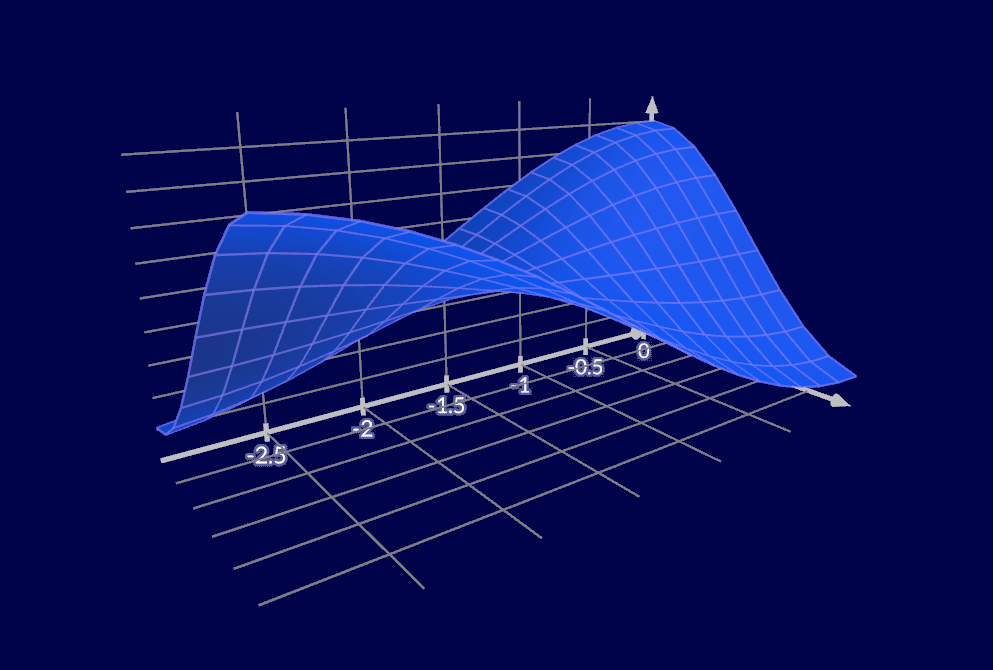
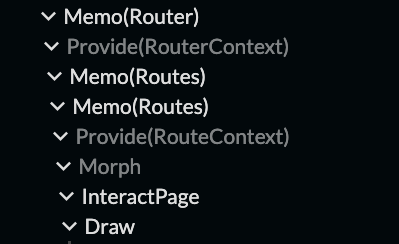
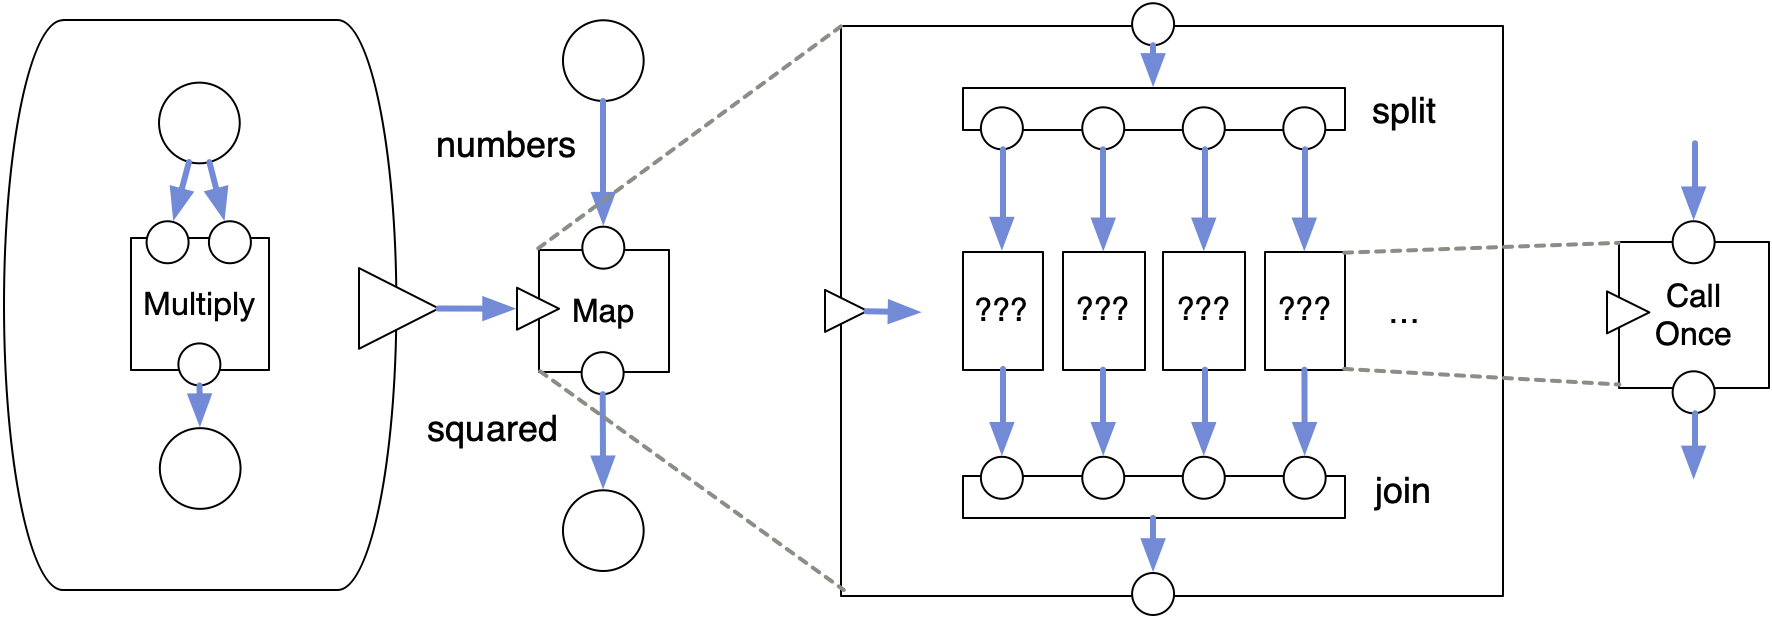
I believe reconcilers like React or tree-sitter are a major guide stone here. What they do is apply structure-preserving transforms on data structures, and incrementally. They actually do the annoying part for you. I based Use.GPU on the same principles, and use it to drive CPU canvases too. The tree-based structure reflects that one function's state just might be the next function's intent, all the way down. This is a compelling argument that the data and the code should have roughly the same shape.
You will also conclude there is nothing more nefarious than a hard split between back-end and front-end. You know, coded by different people, where each side is only half-aware of the other's needs, but one sits squarely in front of the other. Well-intentioned guesses about what the other end needs will often be wrong. You will end up with data types and query models that cannot answer questions concisely and efficiently, and which must be babysat to not go stale.
In the last 20 years, little has changed here in the wild. On the back-end, it still looks mostly the same. Even when modern storage solutions are deployed, people end up putting SQL- and ORM-like layers on top, because that's what's familiar. The split between back-end and database has the exact same malaise.
None of this work actually helps make the app more reliable, it's the opposite: every new feature makes on-going development harder. Many "solutions" in this space are not solutions, they are copes. Maybe we're overdue for a NoSQL-revival, this time with a focus on practical schema design and mutation? SQL was designed to model administrative business processes, not live interaction. I happen to believe a front-end should sit next to the back-end, not in front of it, with only a thin proxy as a broker.
What I can tell you for sure is: it's so much better when intent is a first-class concept. You don't need nor want to treat user data as something to pussy-foot around, or handle like it's radioactive. You can manipulate and transport it without a care. You can build rich, comfy functionality on top. Once implemented, you may find yourself not touching your network code for a very long time. It's the opposite of overwhelming, it's lovely. You can focus on building the tools your users need.
This can pave the way for more advanced concepts like OT and CRDT, but will show you that neither of them is a substitute for getting your application fundamentals right.
In doing so, you reach a synthesis of Dijkstra and anti-Dijkstra: your program should be provably correct in its data flow, which means it can safely break in completely arbitrary ways.
Because the I in UI meant "intent" all along.
More: