MathBox²
PowerPoint Must Die
"I think a lot of mathematics is really about how you understand things in your head. It's people that did mathematics, we're not just general purpose machines, we're people. We see things, we feel things, we think of things. A lot of what I have done in my mathematical career has had to do with finding new ways to build models, to see things, do computations. Really get a feel for stuff.
It may seem unimportant, but when I started out people drew pictures of 3-manifolds one way and I started drawing them a different way. People drew pictures of surfaces one way and I started drawing them a different way. There's something significant about how the representation in your head profoundly changes how you think.
It's very hard to do a brain dump. Very hard to do that. But I'm still going to try to do something to give a feel for 3-manifolds. Words are one thing, we can talk about geometric structures. There are many precise mathematical words that could be used, but they don't automatically convey a feeling for it. I probably can't convey a feeling for it either, but I want to try."– William Thurston, The Mystery of 3-Manifolds (Video)
How do you convince web developers—heck, people in general—to care about math? This was the challenge underlying Making Things With Maths, a talk I gave three years ago. I didn't know either, I just knew why I liked this stuff: demoscene, games, simulation, physics, VR, … It had little to do with what passed for mathematics in my own engineering education. There we were served only eyesore PowerPoints or handwritten overhead transparencies, with simplified graphs, abstract flowcharts and rote formulas, available on black and white photocopies.
Smart people who were supposed to teach us about technology seemed unable to teach us with technology. Fixing this felt like a huge challenge where I'd have to start from scratch. This is why the focus was entirely on showing rather than telling, and why MathBox 1 was born. It's how this stuff looks and feels in my head, and how I got my degree: by translating formulas into mental pictures, which I could replay and reason about on demand.
PowerPoint Syndrome
Initially I used MathBox like an embedded image or video: compact diagrams, each a point or two in a presentation. My style quickly shifted though. I kept on finding ways to transform from one visualization to another. Not for show, but to reveal the similarities and relationships underneath. MathBox encouraged me to animate things correctly, leveraging the actual models themselves, instead of doing a visual morph from A to B. Each animation became a continuous stream of valid examples, a quality both captivating and revealing.
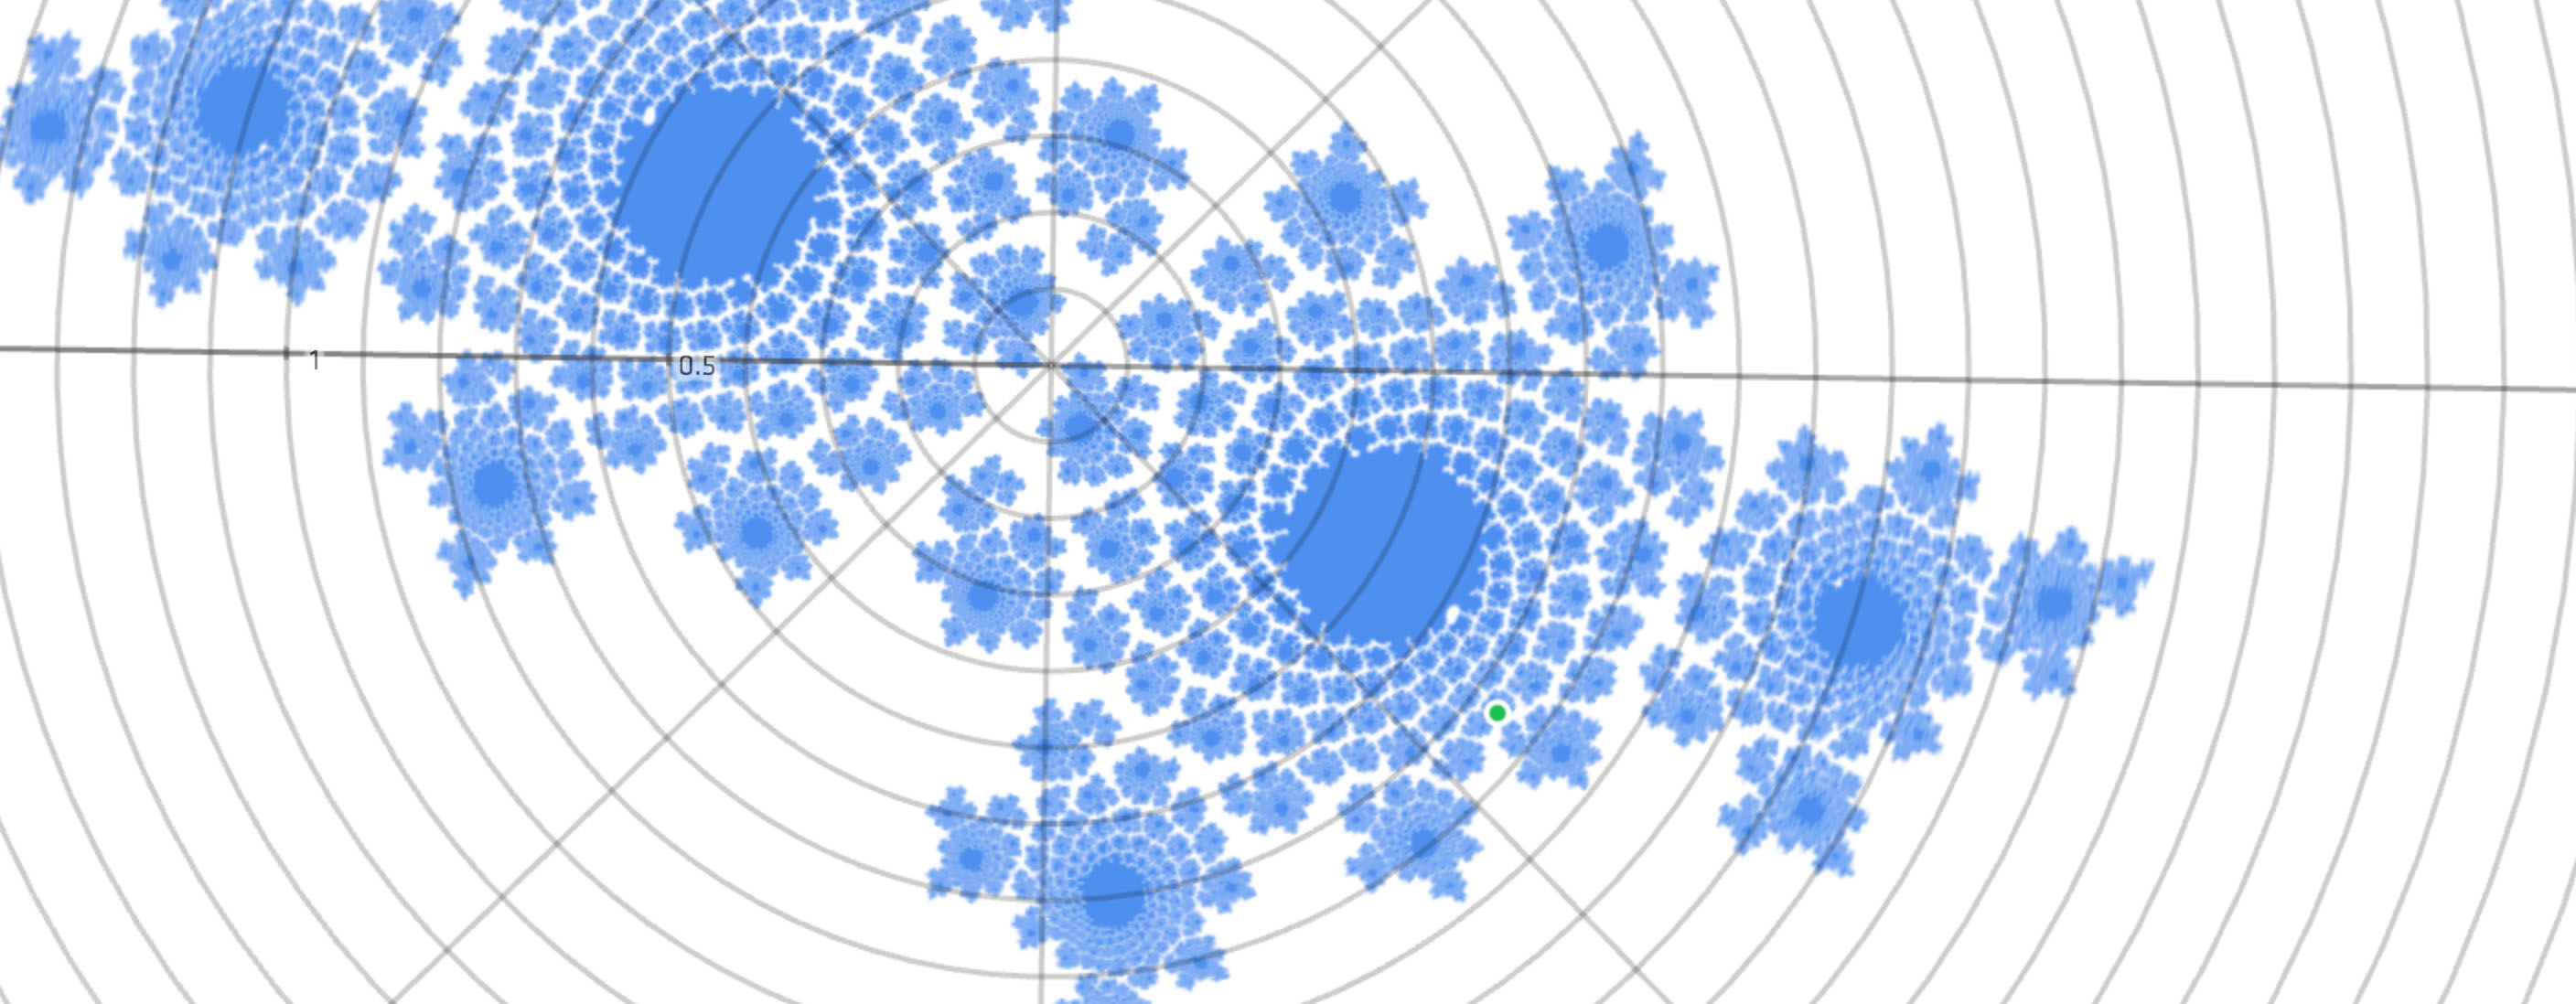
For instance, How to Fold a Julia Fractal is filled with animations of complex exponentials, right from the get go. This way I avoid the scare that ($ e^{i\pi} $) is a meaningful expression; symbology and tau-tology never have a chance to obscure geometrical workings. Instead a web page that casually demonstrates conformal mapping and complex differential equations got 340,000 visits. Despite spotty web browser support and excluding all mobile phones for years.
The next talk, Making WebGL Dance, contained elaborate long takes worthy of an Alfonso Cuarón film, with only 3 separate shots for the bulk of a 30 minute talk. The lesson seemed obvious: the slides shouldn't have graphics in them, rather, the graphics should have slides in them. The diagnosis of PowerPoint syndrome is then the constant trashing of context from one slide to the next. A traditional blackboard doesn't have this problem: you build up diagrams slowly, by hand, across a large surface, erasing selectively and only when you run out of space.
It's not just about permanence and progression though, it's also about leveraging our natural understanding of shape, scale, color and motion. Think of how a toddler learns to interact with the world: poke, grab, chew, spit, smash. Which evolves into run, jump, fall, get back up again. Humans are naturals at taking multiple cases of "If I do this, that will happen" and turning it into a consistent, functional model of how things work. We learn language by bootstrapping random jibberish into situational meaning, converging on a shared protocol.
That said, I find the usual descriptions of how people experience language and thought foreign. Instead, when Temple Grandin speaks about visual thinking, I nod vigorously. Thought to me is analog concepts and sensory memories, remixed with visual and other simulations. It builds off the quantities and qualities present in spatial and temporal notions, which appear built-in to us.
Speech and writing is then a program designed to reconstruct particular thoughts in a compatible brain. There are a multitude of evolving languages, they can be used elegantly, bluntly, incomprehensibly, but the desired output remains the same. In my talks, armed with weapons-grade C2-continuous animations, it is easy to transcode my film reel into words, because the slides run themselves. The string of concepts already hangs in the air, I only add the missing grammar that links them up. This is a puzzle our brains are so good at solving, we usually do it without thinking.
Language is the ability of thoughts to compute their own source code.
(It's not proof, I just supply pudding.)
Manifold Dreams
I don't say all this to up my Rain Man cred, but to lay to rest the recurring question of where my work comes from. I translate the pictures in my head to HD, in order to learn from and refine the view. As I did with quaternions: I struggled to grok the hypersphere, it wouldn't fit together right. So I wrote the code to trace out geodesics in color and fly around in it, and suddenly the twisting made sense. Hence my entire tutorial was built to replicate the same discovery process I went through myself.
There was one big problem: scenes now consisted of diagrams of diagrams, which meant working around MathBox more than with it. Performance issues arose as complexity grew. Above all there was a total lack of composability in the components. None of this could be fixed without ripping out significant pieces, so doing it incrementally seemed futile. I started from scratch and set off to reinvent all the wheels.
$$ \text{MathBox}^2 = \int_1^2 \text{code}(v) dv $$
MathBox 2 was inevitably going to suffer second-system syndrome, parts would be overengineered. Rather than fight it, I embraced it and effectively wrote a strange vector GPU driver in CoffeeScript. (Such is life, this is a blueprint meant to be simplified and made obsolete over time, not expanded upon.) It's a freight train straight to the heart of a graphics card, combining low-level and high-level in a way that feels novel 🐴 when you use it, squeezing 🐴 through a very small opening.
What was tedious before, now falls out naturally. If I format the scene above as XML/JSX, it becomes:
<root>
  <!-- Place the camera -->
  <camera />
  <!-- Change clock speed -->
  <clock>
    <!-- 4D Stereographic projection -->
    <stereographic4>
      <!-- Custom 4D rotation shader -->
      <shader />
      <!-- Move vertices -->
      <vertex>
        <!-- Sample an area -->
        <!-- Draw a set of lines -->
        <area />
        <line />

        <!-- Sample an area -->
        <!-- Draw a set of lines -->
        <area />
        <line />

        <!-- Sample an area -->
        <!-- Draw a set of lines -->
        <area />
        <line />
      </vertex>
    </stereographic4>
  </clock>
</root>
In order to make these pieces behave, a bunch of additional attributes are applied, most of which are strings or values, some of which are functions/code, either JavaScript or GLSL:
<root id="1" scale={300}>
  <camera id="2" proxy={true} position={[0, 0, 3]} />
  <clock id="3" speed={1/4}>
    <stereographic4 id="4" bend={1}>
      <shader id="5" code="
uniform float cos1;
uniform float sin1;
uniform float cos2;
uniform float sin2;
uniform float cos3;
uniform float sin3;
uniform float cos4;
uniform float sin4;

vec4 getRotate4D(vec4 xyzw, inout vec4 stpq) {
  xyzw.xy = xyzw.xy * mat2(cos1, sin1, -sin1, cos1);
  xyzw.zw = xyzw.zw * mat2(cos2, sin2, -sin2, cos2);
  xyzw.xz = xyzw.xz * mat2(cos3, sin3, -sin3, cos3);
  xyzw.yw = xyzw.yw * mat2(cos4, sin4, -sin4, cos4);

  return xyzw;
}"
 cos1=>{(t) => Math.cos(t * .111)} sin1=>{(t) => Math.sin(t * .111)} cos2=>{(t) => Math.cos(t * .151 + 1)} sin2=>{(t) => Math.sin(t * .151 + 1)} cos3=>{(t) => Math.cos(t * .071 + Math.sin(t * .081))} sin3=>{(t) => Math.sin(t * .071 + Math.sin(t * .081))} cos4=>{(t) => Math.cos(t * .053 + Math.sin(t * .066) + 1)} sin4=>{(t) => Math.sin(t * .053 + Math.sin(t * .066) + 1)} />
      <vertex id="6">
        <area id="7" rangeX={[-π/2, π/2]} rangeY={[0, τ]} width={129} height={65} expr={(emit, θ, ϕ, i, j) => {
        q1.set(0, 0, Math.sin(θ), Math.cos(θ));
        q2.set(0, Math.sin(ϕ), 0, Math.cos(ϕ));
        q1.multiply(q2);
        emit(q1.x, q1.y, q1.z, q1.w);
      }} live={false} channels={4} />
        <line id="8" color="#3090FF" />
        <area id="9" rangeX={[-π/2, π/2]} rangeY={[0, τ]} width={129} height={65} expr={(emit, θ, ϕ, i, j) => {
        q1.set(0, Math.sin(θ), 0, Math.cos(θ));
        q2.set(Math.sin(ϕ), 0, 0, Math.cos(ϕ));
        q1.multiply(q2);
        emit(q1.x, q1.y, q1.z, q1.w);
      }} live={false} channels={4} />
        <line id="10" color="#20A000" />
        <area id="11" rangeX={[-π/2, π/2]} rangeY={[0, τ]} width={129} height={65} expr={(emit, θ, ϕ, i, j) => {
        q1.set(Math.sin(θ), 0, 0, Math.cos(θ));
        q2.set(0, 0, Math.sin(ϕ), Math.cos(ϕ));
        q1.multiply(q2);
        emit(q1.x, q1.y, q1.z, q1.w);
      }} live={false} channels={4} />
        <line id="12" color="#DF2000" />
      </vertex>
    </stereographic4>
  </clock>
</root>
Phew. That's how you make a 4D diagram with Hopf fibration as far as the eye can see. Except it's not actually JSX, that's just me and my pretty-printer pretending.
Geometry Streaming
The key is the data itself. It's an array of points mostly, but how that data is laid out and interpreted determines how useful it can be.
Most basic primitives come in fixed size chunks. Particles are single points, lines have two points, triangles have three points. Polygons and polylines have N points. So it made sense to have a tuple of N points be the basic logical unit. You can think in logical pieces of geometry, rather than raw points or individual triangles, unlike GL.
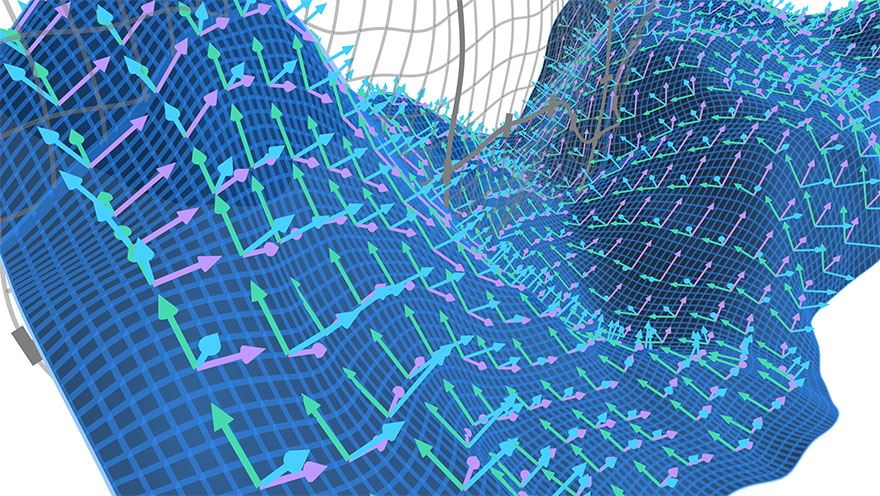
Each primitive maps over data in a standard way. Feed an array of points to a line, you get a polyline. Feed a matrix of points to a surface and you get a grid mesh. Simple. But feed a voxel to a vector, and you get a 3D vector field. The general idea is that drawing 1 of something should be as easy as drawing 100×100×100.
This is particularly useful for custom data expressions, which stream in live or procedural data. They now receive an emit(x, y, z, w) function, for emitting a 4-vector like XYZW or RGBA. This is little more than an inlineable call to fill a floatArray[i++] = x, quite a lot faster than returning an array or object.
mathbox
  .interval({
    expr: function (emit, x, i, t) {
      y = Math.sin(x + t);
      emit(x,  y);
      emit(x, -y);
    },
    width:   64,
    items:    2,
    channels: 2,
  })
  .vector({
    color: 0x3090FF,
    width: 3,
    start: true,
  });
Emitting 64 2D vectors on an interval, 2 points each.
More importantly it lets you emit N points in one iteration, which makes the JS expressions themselves feel like geometry shaders. The result feeds into one or more styled drawing ops. The number of emit calls has to be constant, but you can always knock out or mask the excess geometry.
emit = switch channels
  when 1 then (x) ->
    array[i++] = x
    ++j
    return

  when 2 then (x, y) ->
    array[i++] = x
    array[i++] = y
    ++j
    return

  when 3 then (x, y, z) ->
    array[i++] = x
    array[i++] = y
    array[i++] = z
    ++j
    return

  when 4 then (x, y, z, w) ->
    array[i++] = x
    array[i++] = y
    array[i++] = z
    array[i++] = w
    ++j
    return
Both the expression and emitter will be inlined into the stream's iteration loop.
consume = switch channels
  when 1 then (emit) ->
    emit array[i++]
    ++j
    return

  when 2 then (emit) ->
    emit array[i++], array[i++]
    ++j
    return

  when 3 then (emit) ->
    emit array[i++], array[i++], array[i++]
    ++j
    return

  when 4 then (emit) ->
    emit array[i++], array[i++], array[i++], array[i++]
    ++j
    return
Closures of Hanoi
(4-in-1)²
GPUs can operate on 4×1 vectors and 4×4 matrices, so working with 4D values is natural. Values can also be referenced by 4D indices. With one dimension reserved for the tuples, that leaves us 3 dimensions XYZ. Hence MathBox arrays are 3+1D. This is for width, height, depth, while the tuple dimension is called items. It does what it says on the tin, creating 1D W, 2D W×H and 3D W×H×D arrays of tuples. Each tuple is made of N vectors of up to 4 channels each.
Thanks to cyclic buffers and partial updates, history also comes baked in. You can use a spare dimension as a free time axis, retaining samples on the go. You can .set('history', N) to record a short log of a whole array over time, indefinitely.
All of this is modular: a data source is something that can be sampled by a 4D pointer from GLSL. Underneath, arrays end up packed into a regular 2D float texture, with "items × width" horizontally and "height × depth" vertically. Each 'pixel' holds a 1/2/3/4D point.
Mapping a 4D 'pointer' to the real 2D UV coordinates is just arithmetic, and so are operators like transpose and repeat. You just swap the XY indices and tell everyone downstream that it's now this big instead. They can't tell the difference.
You can create giant procedural arrays this way, including across rectangular texture size limits, as none of them actually exist except as transient values deep inside a GPU core. Until you materialize them by rendering to a texture using the memo primitive. Add in operators like interpolation and convolution and it's a pretty neat real-time finishing kit for data.
