Hackery, Math & Design

Steven Wittens i

Animate Your Way to Glory

Animate Your Way to Glory

Math and Physics in Motion

“The last time that I stood here was seven years ago.”
“Seven years ago! How little do you mortals understand time.
Must you be so linear, Jean-Luc?”
– Picard and Q, All Good Things, Star Trek: The Next Generation

Note: This article is significantly longer than previous instalments. It features 4 interactive slideshows, each introducing a new tool as well as related concepts around it. In one way, it's just another math guide, but going much deeper. In another, it's a thesis on everything I know about animating. Their intersection is a handbook for anyone who wants to make things move with code, but I hope it's an interesting read even if that's not your goal.

Developers have a tough job these days. A seamless experience is mandatory, polish is expected. On touch devices, they are expected to become magicians. The trick is to make an electronic screen look and feel like something you can physically manipulate. Animation is the key to all of this.

Not just any animation though. Flash intros were hated for a reason. The <blink> tag is not your friend, and flashing banner ads only annoy rather than invite. If elaborately designed effects distract from the content, or worse, ruin smoothness and performance, it'll turn people off rather than endear. Animation can only add value when its fast and fluid enough to be responsive.

It's not mere polish either, a finishing touch. Animation–and UI in general—should always be an additional conversation with the user, not a representation of internal software or hardware state. When we press Play in a streaming music app, the app should respond immediately by showing a Pause control, even if the music won't actually start playing for another second. When we enable Airplane Mode on our phones, we don't care that it'll take a few seconds to say good bye to the cell tower and turn off the radio. The UI is there to respond to our wishes: it should act like a personal assistant, not a reluctant helper, or worse, a demanding master.

Hence animation is visual language and communicates both explicitly and implicitly. It establishes an unspoken trust and confidence between designer and user: we promise nothing will appear, change or disappear without explanation. It can show where to find things, like an application that minimizes into place in the dock, or a picture sliding into a thumbnail strip. It can tell miniature stories, like a Download button turning into a progress bar turning into a checkmark. More simply just the act of scrolling around a live document, creating the illusion of viewing an infinite canvas, persisting in space and time. Here, page layout is the use of placement and style to denote hierarchy and meaning in a 2D space.

As with any conversation, tone matters, in this case expressed through choreography. Items can fade into the background or pop to demand our attention, expressing calm or assertiveness. Elements can complement or oppose, creating harmony or dissonance. Animations can be minimalist or baroque, ordered or parallel, independent or layered. The proper term for this is staging, and research shows that it can significantly increase our understanding of diagrams and graphs when applied carefully. Whenever elements transition, preferably one at a time, it is easier to gauge changes in color, size, shape and position than when we are only shown a before and after shot.

This is important everywhere, but especially so for abstract topics like data visualization and mathematics. When we have no natural mental model of something, we build our understanding based on the interface we use to examine it. The more those interfaces act like real objects, the less surprising they are.

In doing so, we replace explicit explanations with implicit metaphors from the natural world: distance, direction, scale, shadow, color, contrast. These are the cues our brains evolved to be excellent at interpreting. By imbuing virtual objects with these properties, we make them more realistic and thus more understandable. Mind you, this is not a call for skeuomorphism, far from it. The properties we are seeking to mimic are far more basic, far more important, than some faux leather and stitching.

The clearest example of this has to be inertial scrolling. Compared to an ordinary mouse wheel, scrolling on a tablet is actually much more complicated. We can flick and grab, go as fast or slow as we want. When skimming through a list, often we never wait for the page to stop moving, in theory requiring more effort to read. Yet everyone who's seen a toddler with an iPad can attest to its uncanny ease of use and efficiency, offering improved control and comprehension. Our brains are very good at tracking and manipulating objects in motion, particularly when they obey the laws of physics: moving with consistent inertia and force.

Which brings me to the actual topic of this post: how animation works on a fundamental level. I'd like to teach a mental model based on physics and math, and how to precisely control it. Along the way, we'll come to understand why Apple built a physics engine into iOS 7's UI, reveal some secrets of the demoscene, compose fluid keyframe animations, and defeat the final boss: seamless rotation in 3D. In doing so, we'll also go beyond just visual animation. The techniques described here work equally well for manipulating audio, processing data or driving meatspace devices. In a world of data, animation is just a different word for precise control.

A Matter of Time

An animation is something that changes over time. As it so happens, these three humble words are a veritable Pandora's box of mathematics. They open up to the strange world of the continuously and infinitely dividable, also known as calculus.

In a previous article, I covered the origins of calculus and how to approach the concept of infinity. In what follows, we won't be needing it much though. We'll be working with finite steps throughout, with discrete time. This makes it vastly easier to understand, and is an eminently useful stepping stone to the true theory of continuous motion, which you can find in any good physics textbook.

Math class hates it when we just punch numbers into our calculator instead of deducing the exact result: a decimal number is meaningless on its own. On that, I can agree. But when we punch in a couple thousand numbers and look at them in aggregate, it can tell us just as much. This page will be your calculator.

Let's start where Isaac Newton supposedly did, with an apple.

Gravity kicks in. The apple bounces off the ground, losing some energy in the process. After a few bounces, its kinetic energy (speed) and potential energy (height) have both dissipated, and the apple is at rest.

But analyzing motion by watching it in real-time is tricky. It's better to visualize time as its own dimension, here horizontal, and look at the entire animation as a whole.

$$ \class{blue}{p(t)} $$

The apple's position $ \class{blue}{p(t)} $ moves through space and time, along arcs of decreasing height and duration. Once at rest, it continues advancing through time, without moving in space. In common parlance, this is the animation's easing curve.

$$ \class{blue}{p_i}, \, t_i $$

It's worth pointing out they're not really arcs. This animation consists of individually numbered frames $ i $, switching 60 times per second. While a frame is displayed, the position $ \class{blue}{p_i} $ of the apple is constant. In between its value changes instantly, at times $ t_i $.

For convenience's sake, it's reasonable to consider this a curve, approximated by a series of straight lines. After all, that's the illusion that the animation successfully tricks us into seeing. The discrete nature of the curve will let us dissect it more easily. We're interested in the physics of this motion.

$$ \class{green}{v_{i→}} = \frac{\class{blue}{p_{i+1}} - \class{blue}{p_{i}}}{t_{i+1} - t_i} $$

To determine the speed of the apple, we find the slope of a line segment: vertical divided by horizontal. Dividing distance by time gives us speed, e.g. meters per second. But actually, we're dealing with its cousin velocity which has a direction too. Positive slope means going up, negative slope means going down. This operation is called a forward or backward difference, depending on whether you look forward ($ \class{green}{v_{i→}} $) or backward ($ \class{green}{v_{←i}} $) around a point.

$$ \class{green}{v_{i↓}} = \frac{\class{blue}{p_{i+1}} - \class{blue}{p_{i-1}}}{t_{i+1} - t_{i-1}} $$

Forward differences tell us about what's happening between two adjacent points. We're more interested in what's happening at the points themselves. To fix this, we can take a central difference $ \class{green}{v_{i↓}} $, spanning two frames instead. We now get a good approximation for the slope directly at a point of interest, and thus the velocity.

$$ \class{blue}{p_i}, \, \class{green}{v_{i↓}} $$

If we apply this procedure along the entire curve, we can graph the apple's velocity over time, in sync with its position. This is the discrete version of taking the derivative in calculus, or differentiation and shows these two quantities are intimately related.

While in the air, the apple's velocity decreases along a straight line, first positive, then negative. On impact, the velocity suddenly reverses, though only to a portion of its previous value. At the top of each arc, the velocity passes through zero, which means the apple essentially hangs motionless in the air for a fraction of a second.

$$ \class{blue}{p_i}, \, \class{green}{v_{i↓}}, \, \class{orangered}{a_{i↓}} $$

To further analyze this, we can repeat the procedure, and find the slope of the velocity. This is the change in velocity over time, better known as acceleration. It can be expressed in meters per second per second, that is, $ m / s^2 $. According to Newton, acceleration is force divided by mass: the heavier something is, the less effect the same force has.

What looked like a complicated animation at the position level is now revealed to be very simple: the apple undergoes a small constant acceleration downwards from gravity. It also experiences a short burst of much stronger acceleration upwards whenever it bounces. Once the upward force goes below a critical threshold, the apple stops moving. At the end, gravity is countered by the apple's resistance to being squished, and the net acceleration is zero.

Suppose we were given only the acceleration, and wanted to reconstruct the animation. Can we do that?

$$ \class{green}{v_{i+1→}} = \class{green}{v_{i→}} + \class{orangered}{a_{i→}} \cdot (t_{i+1} - t_i) $$

Yep, we just work our way back up. If the acceleration represents a difference in velocity over time, then we can track the velocity by adding these differences back, accumulating them one step at a time. Since we divided the differences by time initially, we'll now have to multiply each value by the time between frames. Technically we need forward differences ($ \class{orangered}{a_{i→}} $) for this, not central ones ($ \class{orangered}{a_{i↓}} $), but the error will be minor.

$$ \class{green}{v_{i+1→}} = \sum\limits_{k=0}^i\class{orangered}{a_{k→}} \cdot Δt $$

In calculus, this accumulation process is called integration. In our case, it's a sum ($ \sum $). As we are multiplying the vertical value $ \class{orangered}{a_{k→}} $ by the horizontal time step $ Δt $, each term represents the area of a thin rectangle. By adding up all these signed areas, positive for up and negative for down, we can approximate the integral and get velocity back. Integrals and areas under curves are very closely linked.

$$ \class{green}{v_{i+1→}} = \class{green}{v_{0→}} + \sum\limits_{k=0}^i\class{orangered}{a_{k→}} \cdot Δt $$ $$ \class{blue}{p_{i+1}} = \class{blue}{p_0} + \sum\limits_{k=0}^i\class{green}{v_{k→}} \cdot Δt $$

Similarly, we can integrate velocity into position by adding up strips of area under the velocity curve, recreating the original bounce. Note that for both sums, we needed to manually specify the starting point. If we didn't set it correctly, the apple would drift, bounce on thin air or penetrate the ground.

We've produced real physical behavior from raw forces like gravity. That means we've just described a real physics engine. It's a one-dimensional one, but a physics engine none the less. It implements Euler integration, a fast but generally inaccurate method. In this case, the reconstruction is not perfect due to the earlier mentioned usage of central rather than forward differences.

We only need one of the three in order to produce a plausible copy of the other two. That means we can control animations on any of the three levels. If we want full control, we specify position directly. For simple constrained motions, we can manipulate velocity and integrate once. For full-on physics, we set acceleration from physical laws and integrate twice. This is why the Newtonian model of motion is so important.

It also reveals smoothness. A smooth animation isn't just continuous in its path. Its velocity is continuous too, without sudden jumps. In some cases, we'll even want smooth acceleration too. An ordinary bounce effect is shown to involve a large acceleration, a sudden jerk. This is a noticeable visual disruption, the kind we generally want to avoid. If you've ever tried to ignore a bouncing icon, you'll know how hard this is.

In fact, jerk is what we call the slope of acceleration. That's three derivatives deep, and it's turtles all the way down. The next ones are imaginatively called snap, crackle and pop, though they signify little directly. A large jerk however implies a sudden, jarring change in force.

$$ \class{purple}{E_p} = m \cdot g \cdot h $$

There's more physics hiding in plain sight. Earlier on, I mentioned energy: kinetic and potential. The apple's available potential energy $ \class{purple}{E_p} $ comes from gravity and is proportional to its height $ h $ above the ground, as well as the mass $ m $ and the local strength of gravity $ g $.

$$ \class{cyan}{E_k} = \frac{1}{2} \cdot m \cdot v^2 $$

The kinetic energy $ \class{cyan}{E_k} $ comes from its motion. It's proportional to the velocity squared. That means each additional meter per second makes the previous ones more energetic, adding more kinetic energy the faster it's already going. To explain, we can imagine the force required to stop a moving object. By increasing the speed, you don't just add additional momentum: the impact also takes less time, concentrating it.

$$ \class{purple}{E_p} = m \cdot g \cdot h $$ $$ \class{cyan}{E_k} = \frac{1}{2} \cdot m \cdot v^2 $$

In a closed system, total momentum is conserved. As we are treating gravity as an outside force, this does not apply. Energy is conserved however. There's a vertical symmetry, where one energy level goes up as the other goes down, and vice versa. So we actually have a fourth level to control physics at: that of energy and potential. With some minor bookkeeping, we can create motion this way, called Hamiltonian mechanics.

$$ \class{royal}{E_t} = \class{purple}{E_p} + \class{cyan}{E_k} $$

The total energy, potential plus kinetic, is perfectly constant between bounces. On impact, a significant amount is lost. Note that the dips towards zero are a side effect of the finite approximation: if the bounce occurs between two frames, the apple appears to slow down for a frame, instantly falling down and bouncing back to where it was one frame earlier. Finite differences are oblivious to this.

The energy levels follow a decaying exponential curve. This is very typical: exponentials show up whenever a quantity is related to its rate of change. Hamiltonian models are useful for more complicated things like 3D roller coasters, where they allow you to abstract away complex interactions into a few concise relations like this.

In simple animation though, we'll generally stick to the direct Newtonian model. We can use it to analyze real use cases. Let's start with a common easing curve, cosine interpolation, used by default in jQuery.animate() and these slides too.

$$ lerp(\class{orangered}{a}, \class{green}{b}, f) = \class{orangered}{a} + (\class{green}{b} - \class{orangered}{a}) \cdot f $$

We animate the apple's position, changing its Y coordinate. In practice, that means we apply linear interpolation, lerping, between the start $ \class{orangered}{a} $ and end $ \class{green}{b} $. We take the starting point and add a fraction $ f $ of the difference $ \class{green}{b} - \class{orangered}{a} $ to it. Half the difference gets us halfway there, and so on. As long as $ f $ is between 0 and 1, we end up somewhere in the middle. When $ f $ reaches 1, the animation is complete.

$$ elerp(\class{orangered}{a}, \class{green}{b}, f) = \class{orangered}{a} + (\class{green}{b} - \class{orangered}{a}) \cdot \class{blue}{ease(f)} $$ $$ \class{blue}{ease(f)} = 0.5 - 0.5 \cdot \cos πf $$

The purpose of the easing curve is then to make the animation non-linear, not in space, but in time: in this case, the apple smoothly starts and stops. We can use any curve we like, e.g. half of a cosine wave of period 2. This eased lerp is the basic building block of any animation system.

$$ \class{blue}{p_i}, \, \class{green}{v_{i↓}}, \, \class{orangered}{a_{i↓}} $$

The effect of the easing curve is visible when we take central differences again, and look at velocity and acceleration. The acceleration has been divided by 3 to fit. This doesn't seem bad, all three quantities appear to change smoothly. This picture is deceptive though.

All curves continue before and after the animation. The smooth cosine ease turns out to be quite jarring in its acceleration: it's like flooring the accelerator from standstill then easing off gently. At the halfway point you start braking, more and more until you stop. It's one of the most responsive animations possible that's still smooth at both ends. Smoother easing curves have smoother accelerations, but respond slower.

$$ \class{blue}{ease(f)} = f^2 $$

A simpler example is the half-ease, here achieved with a quadratic curve $ \class{blue}{f^2} $. The velocity is a linearly increasing ramp. The acceleration is constant, except for a very large instant deceleration at the end. This is like flooring the accelerator from standstill, holding it down for the duration, and then crashing into a wall—the suicide ease. Due to this, half-easing is typically used for fading transitions, where the object is invisible–or the audio inaudible–at the start or end.

$$ \class{blue}{ease(f)} = \left\{ \begin{array}{ll} f^2 & \mbox{if } f \leq 1 \\ 2f - 1 & \mbox{if } f > 1 \end{array} \right. $$

But we can repurpose it quite easily. By tweaking this at the velocity level, we can maintain a constant speed at the end. This is the slow start, and can be expressed directly as an open-ended easing curve. In this case, we allow $ f $ to exceed 1, and the linear interpolation turns into extrapolation for free, no extra charge. We can scale the curve vertically to change the final speed, and scale it horizontally to control the delay. The slow start (and stop) is used throughout these slides.

$$ \class{blue}{ease(f)} = \frac{1}{4} \cdot (1 - \cos 2πf) + \left\{ \begin{array}{ll} f^2 & \mbox{if } f \leq 1 \\ 2f - 1 & \mbox{if } f > 1 \end{array} \right. $$

We can combine curves too. Here, we add a cosine wave to the slow start, creating perhaps the motion of a rising jellyfish. Adding up animations is an easy way to create variations on a theme, used often in the demoscene. The derivatives add straight up too, so all three curves shift up and down by a sine or cosine wave. You can see how a small shift in position can have a large effect on both velocity and acceleration.

The next example is a bit different. Any guesses as to what this is? The hint is in the vertical scale, now measured in pixels. This animation moves almost 1000 pixels in just over one second.

It's an inertial flick gesture, recorded on Mac OS X. We can plot velocity and acceleration again. There's a slight measurement error, visible as noisy ripples on the acceleration, even after smoothing out the data: derivatives are very sensitive to noise. The velocity and acceleration have also been scaled down to fit, as they are both quite large.

The first part of the curve is not an animation at all: it was tracking the direct motion of my finger. Fingers move very smoothly: the acceleration follows a curve up and down. This is more physics: of nerve signals causing muscle fibers to contract and digits to move. This work smoothly converts chemical potential into kinetic energy. The small jump in speed at time 0 is easy to explain: my finger was already moving when it touched the pad.

The second part is the actual inertial animation. It kicks in as soon as the finger leaves the pad. All three values follow an exponential curve past that point, disregarding the noise. But the important one is velocity: the animation starts with the last known velocity and smoothly decays it to zero. Where we end up depends on how fast we were going when the finger left the pad.

$$ \class{green}{v_{i+1→}} = \class{green}{v_{i→}} \cdot (1 - \class{royal}{f}) $$

Inertial scroll is easiest to control at the velocity level. We can measure the initial velocity by finding the position's slope, usually averaged over several frames. We then start at this velocity, but reduce it every frame by a fraction $ \class{royal}{f} $, which is a coefficient of friction. We don't need to care how far we'll go or how long it'll take: we can just keep animating until the velocity gets close enough to 0.

Suppose we do care where we end up. We might be showing a list of items, each 100 pixels tall. It could be good to control the animation so it always stops right at an item. We can't violate the principle of smooth motion, so we can't just change the position or velocity directly. We have to change the coefficient of friction.

$$ \class{green}{v_{i→}} = \class{green}{v_{0→}} \cdot (1 - \class{royal}{f})^i $$

As the velocity follows a simple curve, we don't have to track it manually. We can express it over time as a direct relation, based on the initial velocity $ \class{green}{v_{0→}} $. The exponential nature is clear, with the frame number $ i $ appearing as the exponent of a number between 0 and 1.

$$ \begin{array}{rl} \class{blue}{p_{i}} & = \class{blue}{p_0} + \sum\limits_{k=0}^{i} \class{green}{v_{0→} \cdot (1 - f)^k} \cdot Δt \\ & = \class{blue}{p_0} + \class{green}{v_{0→}} \cdot Δt \cdot \class{purple}{\sum\limits_{k=0}^{i} (1 - f)^k} \end{array} $$

The position at frame $ i $ is then the sum of all the previous velocities times the time step $ Δt $, just like before, relative to the initial position $ \class{blue}{p_0} $. As the time step and initial velocity are constant, we can move both outside the sum.

$$ \begin{array}{rl} \class{blue}{p_∞} & = \class{blue}{p_0} + \class{green}{v_{0→}} \cdot Δt \cdot \class{purple}{\sum\limits_{k=0}^{∞} (1 - f)^k} \\ & = \class{blue}{p_0} + \frac{\class{green}{v_{0→}} \cdot Δt}{\class{royal}{f}} \end{array} $$

To find the final resting position, we theoretically have to continue the animation all the way to infinity. This can be done using a limit. For now, we'll just look up the formula for this infinite sum, a geometric series. We end up dividing by the coefficient of friction: the lower it is, the further we go after all. If the coefficient were 0, there'd be no friction. We'd divide by zero, because there's no final resting position when you never slow down.

$$ \class{royal}{f} = \frac{\class{green}{v_{0→}} \cdot Δt}{\class{blue}{Δp}} $$

We can invert this relationship to find the coefficient of friction required to stop at a given target. We just need the initial distance to the target, $ \class{blue}{Δp} $. To apply this in practice, we determine the friction needed to reach the next couple of items, and pick the one which is closest to the default case. The user won't notice the subtle change in friction—the UI will just magically seem better.

The simulation works identical in all cases and the velocities are still continuous and exponential, which means: physical. This effect only requires one additional calculation at the start, which makes it all the more strange that developers have come up with increasingly jarring ways to achieve something similar.

Now let's try animating in 2D.

$$ x(t) = \sin t $$ $$ y(t) = \sin t $$

We can move the apple in 2D by animating its X and Y coordinates. Here we animate both in lockstep, using a sine wave: the apple moves diagonally, as X and Y are always equal. By adjusting their relative amplitudes, we can control the angle of motion.

$$ x(t) = \sin t $$ $$ y(t) = \sin \frac{7}{8}t $$

If we animate X and Y separately, we create arbitrary paths. Here they both follow a sine wave, but with different frequencies. The resulting path is called a Lissajous curve. The sine waves drift in and out of phase, going from a diagonal to an oval to a circle, and back again.

$$ \class{blue}{\vec p(t)} = \begin{bmatrix} \class{blue}{p_x(t)} \\ \class{blue}{p_y(t)} \end{bmatrix} = \begin{bmatrix} \sin t \\ \sin \frac{7}{8}t \end{bmatrix} $$

It makes more sense to picture the position as a 2D vector, an arrow. It has both a direction and a length, relative to the origin. While the calculation is equivalent—animating X and Y separately—the vector representation is more natural once we look at the derivatives.

$$ \class{green}{\vec v_{i→}} = \frac{\class{blue}{\vec p_{i+1}} - \class{blue}{\vec p_{i}}}{t_{i+1} - t_i} $$

What does slope and velocity mean in this context? The same principle applies: we take the difference in position between two frames, and divide it by the difference in time $ Δt $. In this case, all quantities except time are vectors.

As a single frame is very short, the velocity is quite large, and always tangent to the path. Its length directly represents speed.

If we center the velocity vector, it traces out its own Lissajous curve. This one is slightly different and doubles back on itself at regular intervals.

$$ \class{orangered}{\vec a_{i→}} = \frac{\class{green}{\vec v_{i+1→}} - \class{green}{\vec v_{i→}}}{t_{i+1} - t_i} $$

We can apply finite differences again to dissect velocity into acceleration. It follows yet another Lissajous curve, a scaled and rotated version of the position.

Finally, we can disentangle these curves by plotting them out over time. Position, velocity and acceleration dance around each other. Despite its artificial construction, even this motion is physical: it's what happens when you take an object and hang it off independently moving horizontal and vertical springs of different stiffness. With the right visualization, raw physics is quite beautiful in its own right.

We've seen how to examine an animation at multiple levels of change: position, velocity, acceleration. Differences approximate derivatives and let us to dissect our way down the chain. Accumulators approximate integration and let us construct higher levels from lower ones. Thus we can manipulate an animation at any level. By plugging in correct physical laws or arbitrary formulas, we can produce behavior that is as physical or unphysical as we like.

Customer is King

Everything we've done so far has been independent animation, without interaction. Even inertial scrolling has this luxury: whenever the user is touching, there is no inertia and the animation system is inactive. It's only when you let go that the surface coasts.

In many cases, this is not enough: animations need to be scheduled and executed while retaining full interactivity. Often the animation needs to continue despite its target changing midway. In order to handle such situations, we need to build adaptive models that remain continuous and smooth, no matter what.

We'll also need to drop the assumption that the frame rate—the time step—is constant. In the real world, the frame rate might drop here or there, or be variable altogether. In either case, we'd prefer it if the effect of this was minimal. If we're adding music to an animation, this is essential to prevent desynchronization. It will also have some nasty consequences for our physics engine, and we need to level it up significantly.

So far, we've assumed a constant frame rate.

If our animation is defined by an easing curve, we can look up its value at any point along the way.

It seems at first, variable frame rates are trivial: we can evaluate the curve at arbitrary times instead of pre-set intervals.


$$ \class{green}{v_{i→}} = \frac{\class{blue}{p_{i+1}} - \class{blue}{p_{i}}}{t_{i+1} - t_i} $$


$$ \class{blue}{p_{i+1}} = \class{blue}{p_0} + \sum\limits_{k=0}^i\class{green}{v_{k→}} \cdot Δt_i $$

If we take forward differences to measure slope, we still get a smooth velocity curve. We can accumulate—integrate—these differences back into position as long as we account for a variable time step $ Δt_i $. It seems our physics engine should be unbothered too. But there's a few problems.

$$ \class{green}{v_{i+1→}} = \class{green}{v_{i→}} \cdot (1 - \class{royal}{f}) $$

First, if we implemented inertial scrolling like we did before, multiplying the velocity by $ 1 - \class{royal}{f} $ every frame, we'd get the wrong curve. The amount of velocity lost per frame should now vary, we can no longer treat it as a convenient constant.

$$ \begin{array}{rcl} (1 - \class{purple}{f_i})^\frac{t}{Δt_i} & = & (1 - \class{royal}{f})^\frac{t}{Δt} \\ ⇔ \,\,\, \class{purple}{f_i} & = & 1 - e^{\frac{Δt_i}{Δt} \log_e (1 - \class{royal}{f})} \end{array} $$

If we do the math, we can find an expression for the correct amount of friction $ \class{purple}{f_i} $ per frame for a given step $ Δt_i $, relative to the default $ \class{royal}{f} $ and $ Δt $. Not pretty, and this is just one object experiencing one force. In more elaborate scenarios, finding exact expressions for positions or velocities can be hard or even impossible. This is what the physics engine is supposed to be doing for us.

There's another problem. If we integrate these curve segments to get position, we get an exponential curve, just as before. Did we achieve frame rate independence?

Well, no. If we change the time steps and run the algorithm again, it looks the same. However, the new curve and old curve don't match up. The difference is surprisingly large, as this animation is only half a second long and the average frame rate is identical in both cases. Such errors will compound the longer it runs, and make your program unpredictable.

Luckily we can have our cake and eat it too. We can achieve consistent physics and still render at arbitrary frame rates. We just have to decouple the physics clock from the rendering clock.

Whenever we have to render a new frame, we compare both clocks. If the render clock has advanced past the physics clock, we do one or more simulation steps to catch up. Then we interpolate linearly between the last two values until we run out of physics again.

This means the visuals are delayed by one physics frame, but this is usually acceptable. We can even run our physics at half the frame rate or less to conserve power. Though more error will creep in, this error will be identical between all runs, and we can manually compensate for it if needed.

When we implement variable frame rates correctly, we can produce an arbitrary number of frames at arbitrary times. This buys us something very important, not for the end-user, but for the developer: the ability to skip to any point in time, or at least fast-forward as quickly as your computer can manage.

But just because the simulation is consistent, doesn't mean it's correct or even stable. Euler integration fits our intuitive model of how pieces add up, but it's actually quite terrible. For example, if we made our bouncing apple perfectly elastic in the physical sense—losing no energy at all—and apply Euler, it would start bouncing irregularly, gaining height.

Which means the first bounce simulation wasn't using Euler at all. It couldn't have: the energy wouldn't have been conserved. All the finite differentiation and integration magic that followed only worked neatly because the position data was of a higher quality to begin with. We have to find the source of this phantom energy so we can correct for it, creating the Verlet integration that was used.

We're trying to simulate this path, the ideal curve we'd get if we could integrate with infinitely small steps. We imagine we start at the point in the middle, and would like to step forward by a large amount. The time step is exactly 1 second, so we can visually add accelerations and velocities like vectors, without having to scale them. Note that this is not a gravity arc, the downward force now varies.

$$ \class{green}{v_{i+1→}} = \class{green}{v_{i→}} + \class{orangered}{a_{i→}} \cdot Δt $$ $$ \class{blue}{p_{i+1}} = \class{blue}{p_{i}} + \class{green}{v_{i→}} \cdot Δt $$

Earlier, I said that if we used forward differences, we could get the velocity between two points. And that we could make a reconstruction of position from forward velocity by applying 'Euler integration'. While that's true, that's not actually what Euler integration is.

See, this is a chicken and egg problem. This velocity isn't the slope at the start or the end or even the middle. It's the average velocity over the entire time step. We can't get this velocity without knowing the future position, and we can't get there without knowing the average velocity in the first place.

$$ \class{green}{v_{i+1↓}} = \class{green}{v_{i↓}} + \class{orangered}{a_{i↓}} \cdot Δt $$ $$ \class{blue}{p_{i+1}} = \class{blue}{p_{i}} + \class{green}{v_{i↓}} \cdot Δt $$

The velocity that we're actually tracking is for the point itself, at the start of the frame. Any force or acceleration is calculated based on that single instant. If we integrate, we move forward along the curve's tangent, not the curve itself. This is where the extra height comes from, and thus, phantom gravitational energy.

For any finite step, there will always be some overshooting, because we don't yet know what happens along the way. Euler actually made the same mistake we made earlier: he used a central difference where a forward one was required, because the forward difference can only be gotten after the fact. The 'central difference' here is the actual velocity at a point, the true derivative.

$$ \class{green}{v_{i+1↓}} = \class{green}{v_{i↓}} + \class{orangered}{a_{i↓}} \cdot Δt $$ $$ \class{blue}{p_{i+1}} = \class{blue}{p_{i}} + \frac{\class{green}{v_{i↓}} + \class{green}{v_{i+1↓}}}{2} \cdot Δt $$

As the acceleration changes in this particular scenario, we could try applying Euler, and then averaging the start and end velocities to get something in the middle. It fails, because the end velocity itself is totally wrong. Though we get closer than Euler did, we now undershoot by half the previous amount.

$$ \class{green}{v_{←i}} = \frac{\class{blue}{p_{i}} - \class{blue}{p_{i-1}}}{Δt} $$

To resolve the chicken and egg, we need to look to the past. We assume that rather than starting with one position, we start with two known good frames, defined by us. That means we can take a backwards difference and now know the average velocity of the previous frame. How does this help?

Well, we assume that this velocity happens to be equal or close to the velocity at the halfway point. We also still assume the acceleration is constant for the entire duration. If we then integrate from here to the next halfway point, something magical happens.

$$ \class{green}{v_{i→}} = \class{green}{v_{←i}} + \class{orangered}{a_{i↓}} \cdot Δt $$

We get a perfect prediction for the next frame's average velocity, the forward difference. By always remembering the previous position, we can repeat this indefinitely. That this works at all is amazing: we're applying the exact same operation as before—constant acceleration—for the same amount of time. On just a slightly different concept of velocity. Without even knowing exactly when the object reaches that velocity. That's Verlet integration.

Euler integration failed on a simple constant acceleration like gravity and can only accurately replicate a linear ease $ f $. This motion is a cubic ease $ f^3 $, with linear acceleration that decreases. Verlet still nails it, even when leaping seconds at a time. Why does this work?

Euler integration applies a constant acceleration ahead of a point. If there's any decrease in acceleration, it overestimates by a significant amount. That's on top of stepping in the wrong direction to begin with. Both position and velocity will instantly begin to drift away from their true values.

$$ \class{blue}{p_{i+1}} = 2 \cdot \class{blue}{p_{i}} - \class{blue}{p_{i-1}} + \class{orangered}{a_{i↓}} \cdot Δt^2 $$

Verlet integration applies the same constant acceleration around a point. If the acceleration is a perfect line, the error cancels out: the two triangles make up an equal positive and negative area. By starting with a known good initial velocity and cancelling out subsequent errors, we can precisely track velocity through a linear force. If we simplify the formula, velocity even disappears: we can work with positions and acceleration directly.

As this captures the slope of acceleration, we only get errors if the acceleration curves. In this case, the left and right areas don't cancel out exactly. The missing area however smoothly approaches 0 as the time step shrinks, a further sign of Verlet's error-defeating properties. If we do the math, we find the position has $ O(Δt^2) $ global error: decrease the time step $ Δt $ by a factor of 10, and it becomes 100× more accurate. Not bad.

For completeness, here's the 4th order Runge-Kutta method (RK4), which is a sophisticated modification of Euler integration. It involves taking full and half-frame steps and backtracking. It finds 4 estimates for the velocity based on the acceleration at the start, middle and end.

The physics can then be integrated from a weighted sum of these estimates, with coefficients $ [\frac{1}{6}, \frac{2}{6}, \frac{2}{6}, \frac{1}{6}] $. We end up in the right place, at the right speed. This method offers an $ O(Δt^4) $ global error. Decrease the time step 10× and it becomes 10,000× more accurate. We have a choice of easy-and-good-enough (Verlet) or complicated-but-precise (RK4), at any frame rate. Each has its own perks, but Verlet is most attractive for games.

With physics under our belt, let's move on. Why not animate time itself? This is the variable speed clock and it's dead simple. It's also a great debugging tool: sync all your animations to a global clock and you can activate bullet time at will. You can tell right away if a glitch was an animation bug or a performance hiccup. On this site too: if you hold Shift, everything slows down 5×.

$$ \class{green}{v_{←i}} = \frac{\class{blue}{t_i} - \class{blue}{t_{i-1}}}{\class{blue}{t_i} - \class{blue}{t_{i-1}}} = \frac{Δt_i}{Δt_i} = 1 $$

First, we differentiate the clock's time backwards—because in real-time applications, we don't know what the future holds. This is time's velocity $ \class{green}{v_{←i}} $. As we have to divide by the time step too, the velocity is constant and equal to 1. Let's change that.

$$ \class{blue}{t'_i} = \sum\limits_{k=0}^i \class{green}{v'_{←k}} \cdot Δt_k $$

We can reduce the speed of time at will, by changing $ \class{green}{v_i} $. If we then multiply by the time step $ Δt_i $ again and add the pieces back together incrementally, we get a new clock $ t'_i $. By integrating this way, we only need to worry about slope, not position: time always advances consistently. This is also where variable frame rates pay off: going half the speed is the same job as rendering at twice the frame rate.

Using our other tricks, we can animate $ \class{green}{v_i} $ smoothly, easing in and out of slow motion, or speeding into fast-forward. If we didn't do this, then any animation cued off this clock would jerk at the transition point. This is the chain rule for derivatives in action: derivatives compound when you compose functions. Any jerks caused along the way will be visible in the end result.

If time is smooth, what about interruptions? Suppose we have a cosine eased animation. After half a second, the user interrupts and triggers a new animation. If we abort the animation and start a new one, we create a huge jerk. The object stops instantly and then slowly starts moving again.

One way to solve this is to layer on another animation: one that blends between the two easing curves in the middle. Here it's just another cosine ease, interpolating in the vertical direction, between two changing values. We blend across the entire animation for maximum smoothness. This has a downside though: if the blended animation itself is interrupted, we'd have to layer on another blend, one for each additional interruption. That's too much bookkeeping, particularly when using long animations.

We can fix this by mimicking inertial scrolling. We treat everything that came before as a black box, and assume nothing happens afterwards. We only look at one thing: velocity at the time of interruption.

After determining the velocity of any running animations, we can construct a ramp to match. We start from 0 to create a relative animation.

We can bend this ramp back to zero with another cosine ease, interpolating vertically. This time however, the first easing curve is no longer involved.

If we then add this to the second animation, it perfectly fills the gap at the corner. We only need to track two animations at a time: the currently active one, and a corrective bend. If we get interrupted again, we measure the combined velocity, and construct a new bend that lets us forget everything that came before.

By using a different easing curve for the correction, we can make it tighter, creating a slight wave at the end. Either way, it doesn't matter how the object was moving before, it will always recover correctly.

But what if we get interrupted all the time? We could be tracking a moving pointer, following a changing audio volume, or just have a fidgety user in the chair. We'd like to smooth out this data. The interrupted easing approach would be constantly missing its target, because there is never time for the value to settle. There is an easier way.

$$ \class{blue}{p_{i+1}} = lerp(\class{blue}{p_{i}}, \class{purple}{o_{i}}, \class{royal}{f}) $$

We use an exponential decay, just like with inertial scrolling. Only now we manipulate the position $ p_{i} $ directly: we move it a certain constant fraction towards the target $ \class{purple}{o_{i}} $, chasing it. Here, $ \class{royal}{f} = 0.1 = 10\% $. This is a one-line feedback system that will keep trying to reach its target, no matter how or when it changes. When the target is constant, the position follows an exponential arc up or down.

$$ \class{blue}{p_{i+1}} = lerp(\class{blue}{p_{i}}, \class{purple}{o_{i}}, \class{royal}{f}) $$ $$ \class{cyan}{q_{i+1}} = lerp(\class{cyan}{q_{i}}, \class{blue}{p_{i}}, \class{royal}{f}) $$

The entire path is continuous, but not smooth. That's fixable: we can apply exponential decay again. This creates two linked pairs, each chasing the next, from $ \class{slate}{q_{i}} $ to $ \class{blue}{p_{i}} $ to $ \class{purple}{o_{i}} $. Each level appears to do something akin to integration: it smooths out discontinuities, one derivative at a time. Where a curve crosses its parent, it has a local maximum or minimum. These are signs that calculus is hiding somewhere.

$$ \class{blue}{p_{i+1}} = lerp(\class{blue}{p_{i}}, \class{purple}{o_{i}}, \class{royal}{f}) $$ $$ \class{cyan}{q_{i+1}} = lerp(\class{cyan}{q_{i}}, \class{blue}{p_{i}}, \class{royal}{f}) $$ $$ \class{slate}{r_{i+1}} = lerp(\class{slate}{r_{i}}, \class{cyan}{q_{i}}, \class{royal}{f}) $$

That's not so surprising when you know these are difference equations: they describe a relation between a quantity and how it's changing from one to step to the next. These are the finite versions of differential equations from calculus. They can describe sophisticated behavior with remarkably few operations. Here I added a third feedback layer. The path gets smoother, but also lags more behind the target.

If we increase $ f $ to 0.25, the curves respond more quickly. Exponential decays are directly tuneable, and great for whiplash-like motions. The more levels, the more inertia, and the longer it takes to turn.

$$ \class{blue}{p_{i+1}} = lerp(\class{blue}{p_{i}}, \class{purple}{o_{i}}, \class{blue}{f_1}) $$ $$ \class{cyan}{q_{i+1}} = lerp(\class{cyan}{q_{i}}, \class{blue}{p_{i}}, \class{cyan}{f_2}) $$ $$ \class{slate}{r_{i+1}} = lerp(\class{slate}{r_{i}}, \class{cyan}{q_{i}}, \class{slate}{f_3}) $$

We can also pick a different $ f_i $ for each stage. Remarkably, the order of the $ \class{royal}{f_i} $ values doesn't matter: 0.1, 0.2, 0.3 has the exact same result as 0.3, 0.2, 0.1. That's because these filters are all linear, time-invariant systems, which have some very interesting properties.

If you shift or scale up/down a particular input signal, you'll get the exact same output back, just shifted and scaled in the same way. Even if you shift by less than a frame. We've created filters which manipulate the frequencies of signals directly. These are 1/2/3-pole low-pass filters that only allow slow changes. That's why this picture looks exactly like sampling continuous curves: the continuous and discrete are connected.

Exponential decays retain all their useful properties in 2D and 3D too. Unlike splines such as Bezier curves, they require no set up or garbage collection: just one variable per coordinate per level, no matter how long it runs. It works equally well for adding a tiny bit of mouse smoothing, or for creating grand, sweeping arcs. You can also use it to smooth existing curves, for example after randomly distorting them.

However there's one area where decay is constantly used where it really shouldn't be: download meters and load gauges. Suppose we start downloading a file. The speed is relatively constant, but noisy. After 1 second, it drops by 50%. This isn't all that uncommon. Many internet connections are traffic shaped, allowing short initial bursts to help with video streaming for example.

$$ \class{blue}{p_{i+1}} = lerp(\class{blue}{p_{i}}, \class{purple}{o_{i}}, \class{royal}{f}) $$

Often developers apply slow exponential easing to try and get a stable reading. As you need to smooth quite a lot to get rid of all the noise, you end up with a long decaying tail. This gives a completely wrong impression, making it seem like the speed is still dropping, when it's actually been steady for several seconds. The same shape appears in Unix load meters: it's a lie.

$$ p'_{i+1} = lerp(p'_{i}, \class{purple}{o_{i}}, \class{royal}{f}) $$ $$ \class{cyan}{q_{i+1}} = lerp(\class{cyan}{q_{i}}, p'_{i}, \class{royal}{f}) $$

If we apply double exponential easing, we can increase $ f $ to get a shorter tail for the same amount of smoothing. But we can't get rid of it entirely: the more levels of easing we add, the more the curve starts to lag behind the data. We can do much better.

We can analyze the filters by examining their response to a standard input. If we pass in a single step from 0 to 1, we get the step response for the two filters.

Another good test pattern is a single one frame pulse. This is the impulse response for both filters. The impulse responses go on forever, decaying to 0, but never reaching it. This shows these filters effectively compute a weighted average of every single value they've ever seen before: they have a memory, an infinite impulse response (IIR).

Doesn't this look somewhat familiar? It turns out, the step response is the integral of the impulse response. It's a position. Vice versa, the impulse response is the derivative of the step response. It's a velocity. Surprise, physics!

But it gets weirder. Integration sums together all values starting from a certain point, multiplied by the (constant) time step. That means that integration is itself a filter: its impulse response is a single step, the integral of an impulse. Its step response is a ramp, a constant increase.

It works the other way too. Differentiation takes the difference of neighbouring values. It's a filter and its step response is just an impulse, detecting the single change in the step. Its impulse response is an upward impulse followed by a downward one: the derivative of an impulse. When one value is weighed positively and the other weighed negatively, the sum is their difference.

$$ \sum p_i \cdot Δt \,\,\, ↑ $$
$$ ↓ \,\,\, \frac{Δp}{Δt} $$

This explains why exponential filters seem to have integration-like qualities: these are all integrators, they just apply different weights to the values they add up. Every step response is another filter's impulse response, and vice versa, connected through integration and differentiation. We can use this to design filters to spec.

$$ \class{green}{v_{i→}} = \sin \frac{π}{4} t_i $$

That said, filter design is still an art. IIR filters are feedback systems: once a value enters, it never leaves, bouncing around forever. Controlling it precisely is difficult under real world conditions, with finite arithmetic and noisy measurements to deal with. Much simpler is the finite impulse response (FIR), where each value only affects the output for a limited time. Here I use one lobe of a sine wave over 4 seconds.

$$ \class{blue}{p_{i+1}} = \class{blue}{p_0} + \sum\limits_{k=0}^i\class{green}{v_{i→}} \cdot Δt $$

Even if we don't know how to build the filter, we can still analyze it. We can integrate the impulse response to get the step response. But there's a problem: it overshoots, and not by a little. Ideally the filtered signal should settle at the original height. The problem is that the area under the green curve does not add up to 1.

$$ \class{green}{v_{i→}} = \frac{π}{8} \sin \frac{π}{4} t_i \,\,\,\,\,\,\,\,\,\,\, \class{blue}{p_{i}} = \frac{1}{2} + \frac{1}{2} \cos \frac{π}{4} t_i $$

To fix this, we divide the impulse response by the area it spans, $ \class{green}{\frac{8}{π}} $, or multiply by $ \class{green}{\frac{π}{8}} $, normalizing it to 1. Such filters are said to have unit DC gain, revealing their ancestry in analog electronics. The step response turns out to be a cosine curve, and this filter must therefore act like perpetually interruptible cosine easing.

There's two ways of interpreting the step response. One is that we pushed a step through the filter. Another is that we pushed the filter through a step—an integrator. This symmetry is a property of convolution, which is the integration-like operator we've been secretly using all along.

Convolution is easiest to understand in motion. When you convolve two curves $ \class{purple}{q_i} ⊗ \class{green}{r_i} $, you slide them past each other, after mirroring one of them. As our impulse response is symmetrical, we can ignore that last part for now.

$$ \class{blue}{p_i} = \class{purple}{q_i} ⊗ \class{green}{r_i} = \class{cyan}{\sum\limits_{k=-∞}^{+∞}} \class{purple}{q_k} \cdot \class{green}{r_{i-k}} $$

We multiply both curves with each other, creating a new curve in the overlap: here a growing section of the impulse response. The area under this curve is the output of the filter at that time. The sum goes to infinity in both directions, allowing for infinite tails. We already saw something similar when we used a geometric series to determine the final resting position of an inertial scroll gesture. With a FIR filter, the sum ends.

$$ \class{blue}{p_i} = \class{purple}{q_i} ⊗ \class{green}{r_i} = \class{cyan}{\sum\limits_{k=-∞}^{+∞}} \class{purple}{q_k} \cdot \class{green}{r_{i-k}} $$

But why did we have to mirror one curve? It's simple: from the impulse response's point of view, new values approach from the positive X side, now left, not the negative X side, right. By flipping the impulse response, it faces the other signal, which is what we want.

$$ \class{blue}{p_i} = \class{green}{r_i} ⊗ \class{purple}{q_i} = \class{cyan}{\sum\limits_{k=-∞}^{+∞}} \class{green}{r_k} \cdot \class{purple}{q_{i-k}} $$

If we center the view on the impulse response, it's clear we've swapped the role of the two curves. Now it's the step that's passing backwards through the filter, rather than the other way around.

If we replace the step response with a random burst of signal, the filter can work its magic, smoothing out the input through convolution. It's a weighted average with a sliding window. The filter still lags behind the data, but the tail is now finite.

If we make the window narrower, its amplitude increases due to the normalization. We get a more variable curve, but also a shorter tail. This is like a blur filter in Photoshop, only in 1D instead of 2D. As Photoshop has the entire image at its disposal, rather than processing a real-time signal, it doesn't have to worry about lag: it can compensate directly by shifting the result back a constant distance when it's done.

$$ \class{blue}{ease(f)} = \frac{1}{2} - \frac{1}{2} \cdot \cos πf \,\,\,\,\,\,\,\,\,\,\, \class{green}{slope(f)} = \frac{1}{2}π \cdot \sin πf $$

What about custom filter design? Well, if you're an engineer, that's a topic for advanced study, learning to control the level and phase at exact frequencies. If you're an animator, it's much simpler: you pick a desired easing curve, and use its velocity to make a normalized filter. You end up with the exact same step response, turning the easing curve into a perpetually interruptible animation.

$$ \class{blue}{ease(f)} = (\frac{1}{2} - \frac{1}{2} \cdot \cos πf) \cdot (1 + 20f \cdot (1 - f)^\frac{5}{2}) $$

Which leads to the last trick in this chapter: removing lag on a real-time filtered signal. There's always an inherent delay in any filter, where signals are shifted by roughly half the window length. We can't get rid of it, only reduce it. We have to change the filter to prefer certain frequencies over others, making it resonate to the kind of signal we expect. We use an easing curve that overshoots, and preferably a short one. This is just one I made up.

The velocity—here scaled down—now has a positive and negative part. As neither part is normalized by itself, the filter will first amplify any signal it encounters. The second part then compensates by pulling the level back down.

The result is that the filter actually tries to predict the signal, which you can imagine is a useful thing to do. At certain points, the lag is close to 0, when the resonance frequency matches and slides into phase. When applied to animation, resonant filters can create jelly-like motions. When applied to electronic music at about 220 Hz, you get Acid House.

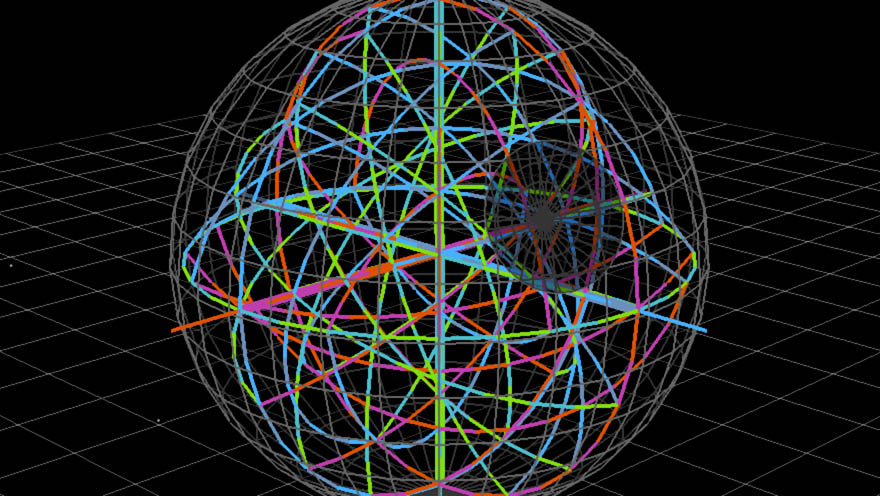
Let's put it all together, just for fun. Here we have some particles being simulated with Verlet integration. Each particle experiences three forces. Radial containment pushes them to within a certain distance of the target. Friction slows them down, opposing the direction of motion. A constantly rotating force, different for each particle, keeps them from bunching up. The target follows the mouse, with double exponential easing.

Friction links acceleration to velocity. Containment links acceleration to position. And integration links them back the other way. These circular dependencies are not a problem for a good physics engine. Note that the particles do not interact, they just happen to follow similar rules.
Tip: Move the mouse and hold Shift to see variable frame rate physics in action.

If we add up the three forces and trace out curves again, we can watch the particles—and their derivatives—speed through time. Just like you are doing right now, in your chair. As velocity and acceleration only update in steps, their curves will only be smooth if the physics clock and rendering clock are synced.

By manipulating time, we've managed to eliminate frame rate issues altogether, even make it work to our advantage. We've discovered more accurate physics engines, so we don't have to waste time simulating tiny steps. We've also created interruptible animations and turned them into filters. We can choose their easing curves and use feedback systems to remove the need for any manual interruptions altogether.

Here, linear time-invariant systems are very useful building blocks: they are simple to implement, but eminently customizable. Both IIR and FIR filters are simple in their basic form. We can also combine feedback systems with other physical or unphysical forces: we can move the target any way we like, perhaps superimposing variation onto existing curves. If we broaden our horizons a bit, we can find applications outside of animation: data analysis, audio manipulation, image processing, and much, much more.

Of course, there are plenty of non-linear and/or non-time-invariant systems too, too many to cover. When dealing with animation though, we'll prefer systems based on physics. They're just the trick to turn a bunch of artificial data into something that feels slick and natural. That said, physics itself is sometimes non-linear: fluids like water, smoke or fire are perfect examples. Solving those particular boondoggles requires the kind of calculus that frightens most adults and large children, so we won't go into that here. It's the same thing though: you simulate it finitely with a couple of clever tricks and the awesome power of raw number crunching.

Continued in part two.

Animation  Featured  Filters  Math  MathBox  Physics  Quaternions  Splines
This article contains graphics made with WebGL, which your browser does not seem to support.
Try Google Chrome or Mozilla Firefox. ×