The GPU Banana Stand
Freshly whipped WebGPU, with ice cream

I recently rolled out version 0.7 of Use.GPU, my declarative/reactive WebGPU library.
This includes features and goodies by itself. But most important are the code patterns which are all nicely slotting into place. This continues to be welcome news, even to me, because it's a novel architecture for the space, drawing heavily from both reactive web tech and functional programming.
Some of the design choices are quite different from other frameworks, but that's entirely expected: I am not seeking the most performant solution, but the most composable. Nevertheless, it still has fast and minimal per-frame code, with plenty of batching. It just gets there via an unusual route.
WebGPU is not available for general public consumption yet, but behind the dev curtain Use.GPU is already purring like a kitten. So I mainly want more people to go poke at it. Cos everything I've been saying about incrementalism can work, and does what it says on the box. It's still alpha, but there are examples and documentation for the parts that have stabilized, and most importantly, it's already pretty damn fun.
If you have a dev build of Chrome or Firefox on hand, you can follow along with the actual demos. For everyone else, there's video.
Immediate + Retained
To recap, I built a clone of the core React run-time, called Live, and used it as the basis for a set of declarative and reactive components.
Here's how I approached it. In WebGPU, to render 1 image in pseudo code, you will have something like:
const main = (props) => {
  const device = useGPUDevice(); // access GPU
  const resource = useGPUResource(device); // allocate a resource

  // ...

  dispatch(device, ...); // do some compute
  draw(device, resource, ...); // and/or do some rendering
};
This is classic imperative code, aka immediate mode. It's simple but runs only once.
The classic solution to making this interactive is to add an event loop at the bottom. You then need to write specific code to update specific resources in response to specific events. This is called retained mode, because the resources are all created once and explicitly kept. It's difficult to get right and gets more convoluted as time goes by.
Declarative programming says instead that if you want to make this interactive, this should be equivalent to just calling main repeatedly with new input props aka args. Each use…() call should then either return the same thing as before or not, depending on whether its arguments changed: the use prefix signifies memoization, and in practice this involves React-like hooks such as useMemo or useState.
In a declarative model, resources can be dropped and recreated on the fly in response to changes, and code downstream is expected to cope. Existing resources are still kept somewhere, but the retention is implicit and hands-off. This might seem like an enormous source of bugs, but the opposite is true: if any upstream value is allowed to change, that means you are free to pass down changed values whenever you like too.
That's essentially what Use.GPU does. It lets you write code that feels immediate, but is heavily retained on the inside, tracking fine grained dependencies. It does so by turning every typical graphics component into a heavily memoized constructor, while throwing away most of the other usual code. It uses <JSX> so instead of dispatch() you write <Dispatch>, but the principle remains the same.
Like React, you don't actually re-run all of main(...) every time: every <Component> boundary is actually a resume checkpoint. If you crack open a random Use.GPU component, you will see the same main() shape inside.
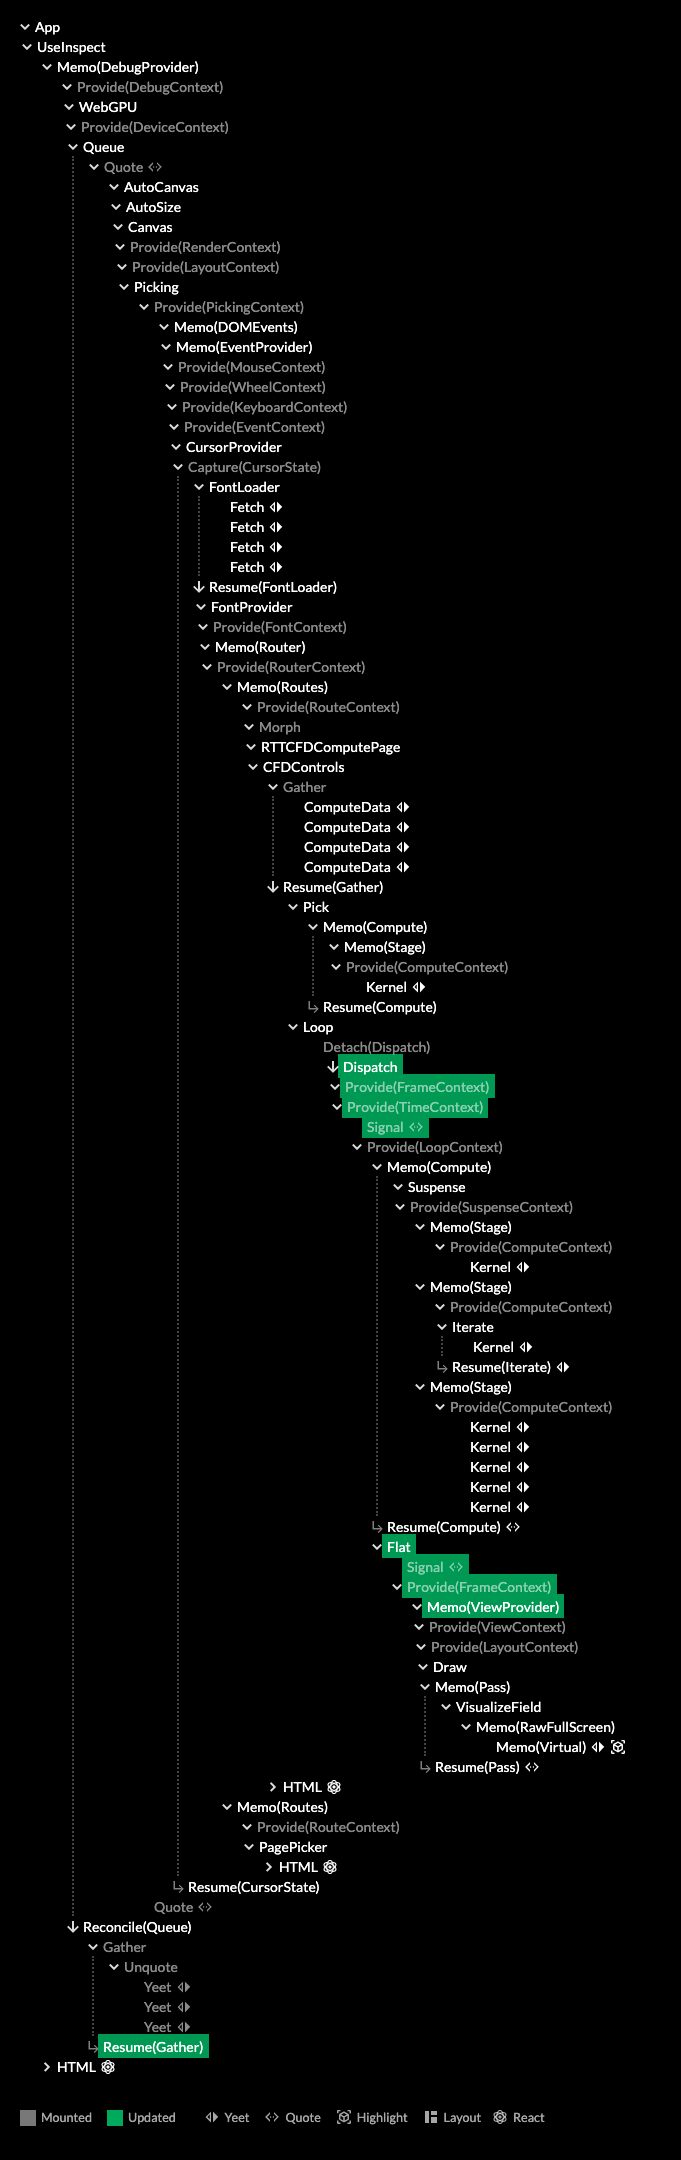
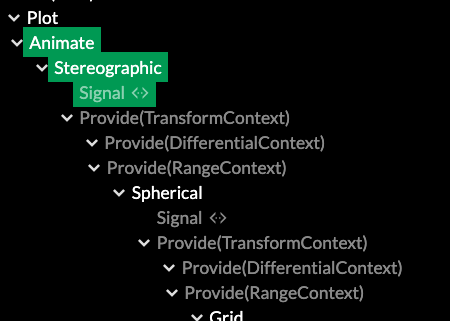
A Live component tree, showing changes in green.
3 in 1
Live goes far beyond the usual React semantics, introducing continuations, tree reductions, captures, and more. These are used to make the entire library self-hosted: everything is made out of components. There is no special layer underneath to turn the declarative model into something else. There is only the Live run-time, which does not know anything about graphics or GPUs.
The result is a tree of functions which is simultaneously:
- an execution trace
- the application state
- a dependency graph of that state
When these 3 concerns are aligned, you get a fully incremental program. It behaves like a big reactive AST expression that builds and rewrites itself. This way, Live is an evolution of React into a fully rewindable, memoized effect run-time.
That's a mouthful, but when working with Use.GPU, it all comes down to that main() function above. This is exactly the mental model you should be having. All the rest is just window dressing to assemble it.
Instead of hardcoded draw() calls, there is a loop for (let task of tasks) task(). Maintaining that list of tasks is what all the reactivity is ultimately in service of: to apply minimal changes to the code to be run every frame, or the resources it needs. And to determine if it needs to run at all, or if we're still good.
So the tree in Use.GPU is executable code knitting itself together, and not data at all. This is very different from most typical scene trees or render graphs: these are pure data representations of objects, which are traversed up and down by static code, chasing existing pointers.
The tree form captures more than hierarchy. It also captures order, which is crucial for both dispatch sequencing and 2D layering. Live map-reduce lets parents respond to children without creating cycles, so it's still all 100% one-way data flow. It's like a node graph, but there is no artificial separation between the graph and the code.
You already have to decide where in your code particular things happen; a reactive tree is merely a disciplined way to do that. Like a borrow checker, it's mainly there for your own good, turning something that would probably work fine in 95% of cases into something that works 100%. And like a borrow checker, you will sometimes want to tell it to just f off, and luckily, there are a few ways to do that too.
The question it asks is whether you still want to write classic GPU orchestration code, knowing that the first thing you'll have to do is allocate some resources with no convenient way to track or update them. Or whether you still want to use node-graph tools, knowing that you can't use functional techniques to prevent it from turning into spaghetti.
If this all sounds a bit abstract, below are more concrete examples.
Compute Pipelines
One big new feature is proper support for compute shaders.
GPU compute is meant to be rendering without all the awful legacy baggage: just some GPU memory buffers and some shader code that does reading and writing. Hence, compute shaders can inherit all the goodness in Use.GPU that has already been refined for rendering.
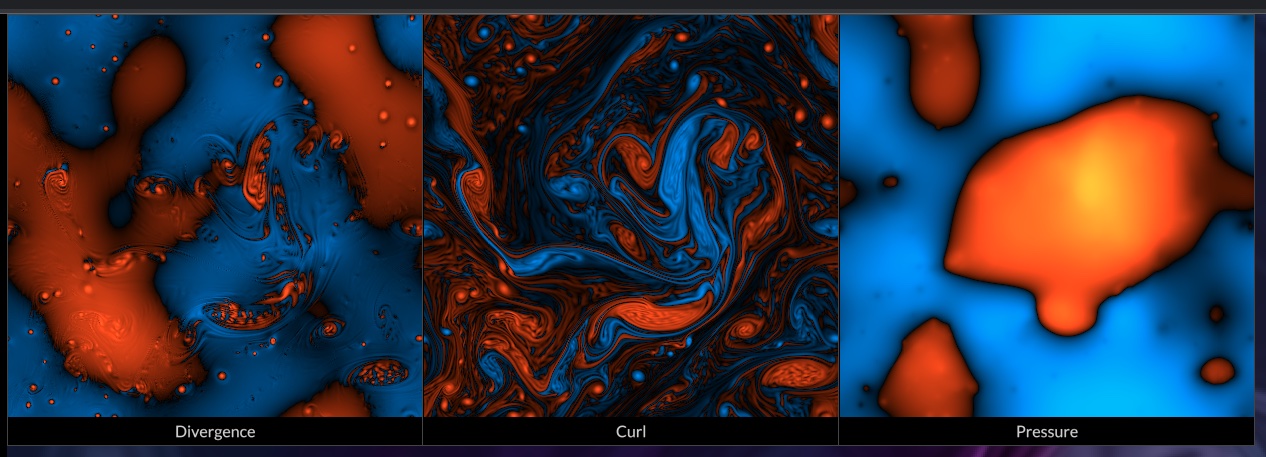
I used it to build a neat fluid dynamics smoke sim example, with fairly decent numerics too.
The basic element of a compute pipeline is just <Dispatch>. This takes a shader, a workgroup count, and a few more optional props. It has two callbacks, one whether to dispatch conditionally, the other to initialize just-in-time data. Any of these props can change at any time, but usually they don't.
If you place this anywhere inside a <WebGPU><Compute>...</Compute></WebGPU>, it will run as expected. WebGPU will manage the device, while Compute will gather up the compute calls. This simple arrangement can also recover from device loss. If there are other dispatches or computes beside it, they will be run in tree order. This works because WebGPU provides a DeviceContext and gathers up dispatches from children.
This is just minimum viable compute, but not very convenient, so other components build on this:
- <ComputeData> creates a buffer of a particular format and size. It can auto-size to the screen, optionally at xN resolution. This can also track N frames of history, like a rotating double or triple buffer. You can use it as a data source, or pass it to <Stage target={...}> to write to it.
- <Kernel> wraps <Dispatch> and runs a compute shader once for every sample in the target. It has conveniences to auto-bind buffers with history, as well as textures and uniforms. It can cycle history every frame. It will also read workgroup size from the shader code and auto-size the dispatch to match the input on the fly.
With these ingredients, a fluid dynamics sim (without visualization) becomes:
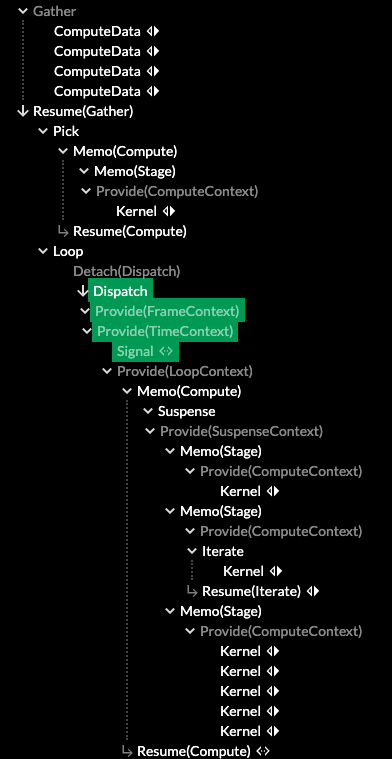
The expanded result.
<Gather
  children={[
    // Velocity + density field
    <ComputeData format="vec4<f32>" history={3} resolution={1/2} />,
    // Divergence
    <ComputeData format="f32" resolution={1/2} />,
    // Curl
    <ComputeData format="f32" resolution={1/2} />,
    // Pressure
    <ComputeData format="f32" history={1} resolution={1/2} />
  ]}
  then={([
    velocity,
    divergence,
    curl,
    pressure,
  ]: StorageTarget[]) => (
    <Loop live>
      <Compute>
        <Suspense>
          <Stage targets={[divergence, curl]}>
            <Kernel shader={updateDivCurl}
                       source={velocity} />
          </Stage>
          <Stage target={pressure}>
            <Iterate count={50}>
              <Kernel shader={updatePressure}
                         source={divergence}
                         history swap />
            </Iterate>
          </Stage>
          <Stage target={velocity}>
            <Kernel shader={generateInitial}
                       args={[Math.random()]}
                       initial />
            <Kernel shader={projectVelocity}
                       source={pressure}
                       history swap />
            <Kernel shader={advectForwards}
                       history swap />
            <Kernel shader={advectBackwards}
                       history swap />
            <Kernel shader={advectMcCormack}
                       source={curl}
                       history swap />
          </Stage>
        </Suspense>
      </Compute>
    </Loop>
  )
/>
Explaining why this simulates smoke is beyond the scope of this post, but you can understand most of what it does just by reading it top to bottom:
- It will create 4 data buffers:
velocity,divergence,curlandpressure - It will set up 3 compute stages in order, targeting the different buffers.
- It will run a series of compute kernels on those targets, using the output of one kernel as the input of the next.
- All this will loop live.
Each of the shaders is imported directly from a .wgsl file, because shader closures are a native data type in Use.GPU.
The appearance of <Suspense> in the middle mirrors the React mechanism of the same name. Here it will defer execution until all the shaders have been compiled, preventing a partial pipeline from running. The semantics of Suspense are realized via map-reduce over the tree inside: if any of them yeet a SUSPEND symbol, the entire tree is suspended. So it can work for anything, not just compute dispatches.
What is most appealing here is the ability to declare data sources, name them using variables, and just hook them up to a big chunk of pipeline. You aren't forced to use excessive nesting like in React, which comes with its own limitations and ergonomic issues. And you don't have to generate monolithic chunks of JSX, you can use normal code techniques to organize that part too.
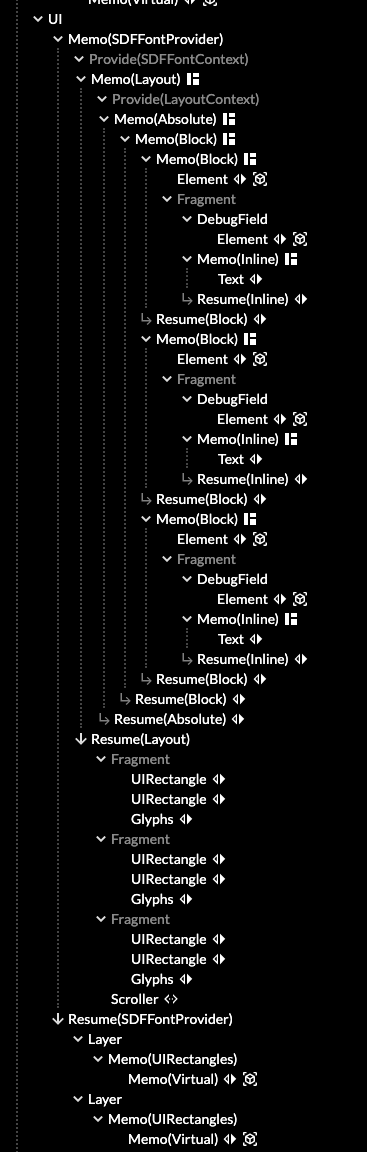
A tree of layout components, reduced into shapes, reduced into layers.
HTML/GPU
The fluid sim example includes a visualization of the 3 internal vector fields. This leverages Use.GPU's HTML-like layout system. But the 3 "divs" are each directly displaying a GPU buffer.
The data is colored using a shader, defined using a wgsl template.
const debugShader = wgsl`
  @link fn getSample(i: u32) -> vec4<f32> {};
  @link fn getSize() -> vec4<u32> {};
  @optional @link fn getGain() -> f32 { return 1.0; };

  fn main(uv: vec2<f32>) -> vec4<f32> {
    let gain = getGain(); // Configurable parameter
    let size = getSize(); // Source array size

    // Convert 2D UV to linear index
    let iuv = vec2<u32>(uv * vec2<f32>(size.xy));
    let i = iuv.x + iuv.y * size.x;

    // Get sample and apply orange/blue color palette
    let value = getSample(i).x * gain;
    return sqrt(vec4<f32>(value, max(value * .1, -value * .3), -value, 1.0));
  }
`;

const DEBUG_BINDINGS = bundleToAttributes(debugShader);

const DebugField = ({field, gain}) => {
  const boundShader = useBoundShader(
    debugShader,
    DEBUG_BINDINGS,
    [field, () => field.size, gain || 1]
  );
  const textureSource = useLambdaSource(boundShader, field);
  return (
    <Element
      width={field.size[0] / 2}
      height={field.size[1] / 2}
      image={ {texture: textureSource} }
    />
  );
};
Above, the DebugField component binds the coloring shader to a vector field. It turns it into a lambda source, which just adds array size metadata (by copying from field).
DebugField returns an <Element> with the shader as its image. This works because the equivalent of CSS background-image in Use.GPU can accept a shader function (uv: vec2<f32>) -> vec4<f32>.
So this is all that is needed to slap a live, procedural texture on a UI element. You can use all the standard image alignment and sizing options here too, because why wouldn't you?
Most UI elements are simple and share the same basic archetype, so they will be batched together as much as drawing order allows. Elements with unique shaders however are realized using 1 draw call per element, which is fine because they're pretty rare.
This part is not new in 0.7, it's just gotten slightly more refined. But it's easy to miss that it can do this. Where web browsers struggle to make their rendering model truly extensible, Use.GPU instead invites you to jump right in using first-class tools. Cos again: shader closures are a native data type the same way that there was money in that banana stand. I don't know how to be any clearer than this.
The shader snippets will end up inlined in the right places with all the right bindings, so you can just go nuts.
Dual Contouring
3D plotting isn't complete without rendering implicit surfaces. In WebGL this was very hard to do well, but in WebGPU it's entirely doable. Hence there is a <DualContourLayer> that can generate a surface for any level in a volume. I chose dual contouring over e.g. marching cubes because it's always topologically sound, and also easy to explain.
Given a volume of data, you can classify each data point as inside or outside. You can then create a "minecraft" or "q-bert" mesh of cube faces, which cleanly separates all inside points from outside. This mesh will be topologically closed, provided it fits within the volume.

In practice, you check every X, Y and Z edge between every adjacent pair of points, and place a cube face that sits across perpendicular. This creates cubes that are offset by half a cell, which is where the "dual" in the name comes from.
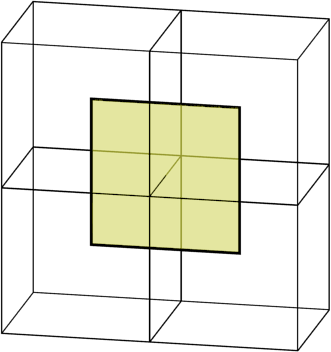
The last step is to make it smooth by projecting all the vertices onto the actual surface (as best you can), somewhere inside each containing cell. For "proper" dual contouring, this uses both the field and its gradients, using a difficult-to-stabilize least-squares fit. But high quality gradients are usually not available for numeric data, so I use a simpler linear technique, which is more stable.
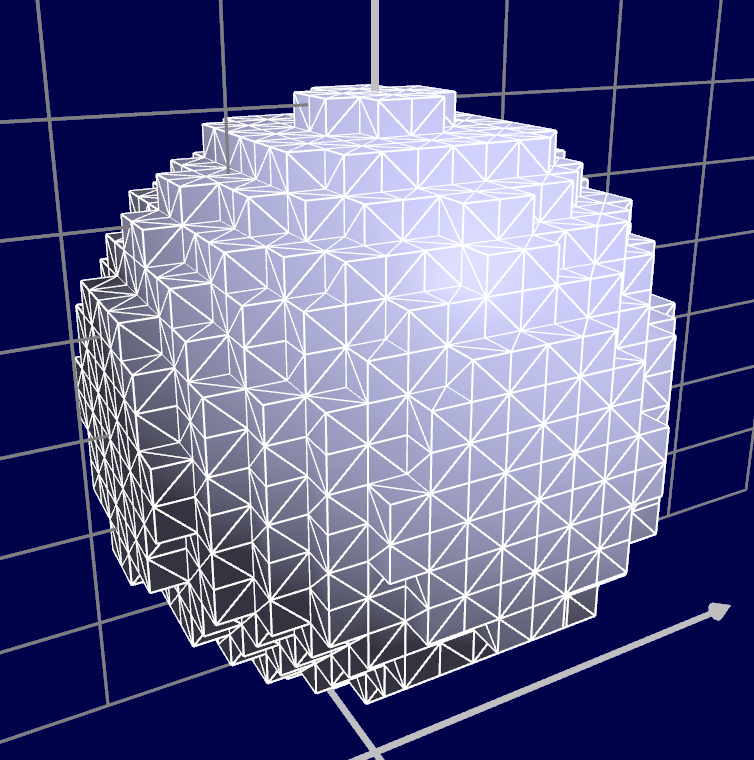
The resulting mesh looks smooth, but does not have clean edges on the volume boundary, revealing the cube-shaped nature. To hide this, I generate a border of 1 additional cell in each direction. This is trimmed off from the final mesh using a per-pixel scissor in a shader. I also apply anti-aliasing similar to SDFs, so it's indistinguishable from actual mesh edges.
<DualContourLayer> is the currently the most complex geometry component in the whole set. But in use, it's a simple layer which you just feed volume data to get a shaded mesh. On the inside it's realized using 2 compute dispatches and an indirect draw call, as well as a non-trivial vertex and fragment shader. It also plays nice with the lighting system, and the material system, the transform system, and so on, each of which comes from the surrounding context.
I'm very happy with the result, though I'm pretty disappointed in compute shaders tbh. The GPU ergonomics are plain terrible: despite knowing virtually nothing about the hardware you're on, you're expected to carefully optimize your dispatch size, memory access patterns, and more. It's pretty absurd.
The most basic case of "embarrassingly parallel shader" isn't even optimized for: you have to dispatch at least as many threads as the hardware supports, or it may have up to 2x, 4x, 8x... slowdown as X% sits idle. Then, with a workgroup size of e.g. 64, if the data length isn't a multiple of 64, you have to manually trim off those last threads in the shader yourself.
There are basically two worlds colliding here. In one world, you would never dream to size anything other than some (multiple of) power-of-two, because that would be inefficient. In the other world, it's ridiculous to expect that data comes in power-of-two sizes. In some ways, this is the real GPU ↔︎ CPU gap.
Use.GPU obviously chooses the world where such trade-offs are unreasonable impositions. It has lots of ergonomics around getting data in, in various forms, and it tries to paper over differences where it can.
Transforms and Differentials
Most 3D engines will organize their objects in a tree using matrix transforms.
In React or Live, this is trivial because it maps to the normal component update cycle, which is batched and dispatched in tree order. You don't need dirty flags: if a matrix changes somewhere, all children affected by it will be re-evaluated.
const Node = ({matrix, children}) => {
  const parent = useContext(MatrixContext);
  const combined = matrixMultiply(parent, matrix);
  return provide(MatrixContext, combined, children);
};
This is a common theme in Use.GPU: a mechanism that normally would have to be coded disappears almost entirely, because it can just re-use native tree semantics. However, Use.GPU goes much further. Matrix transforms are just one kind of transform. While they are a very convenient sweet spot, it's insufficient as a general case.
So its TransformContext doesn't hold a matrix, it holds any shader function vec4<f32> -> vec4<f32>. This operates on the positions. When you nest one transform in the other, it will chain both shader functions in series. The transforms are inlined directly into the affected vertex shaders. If a transform changes, downstream draw calls can incorporate it and get new shaders.
If you used this for ordinary matrices, they wouldn't merge and it would waste GPU cycles. Hence there are still classic matrix transforms in e.g. the GLTF package. This then compacts into a single vec4<f32> -> vec4<f32> transform per mesh, which can compose with other, general transforms.
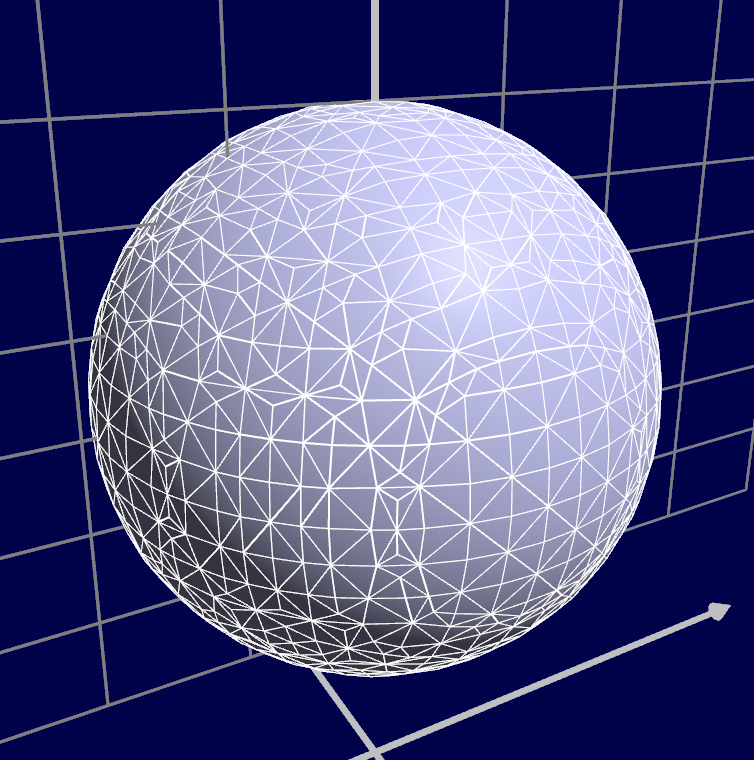
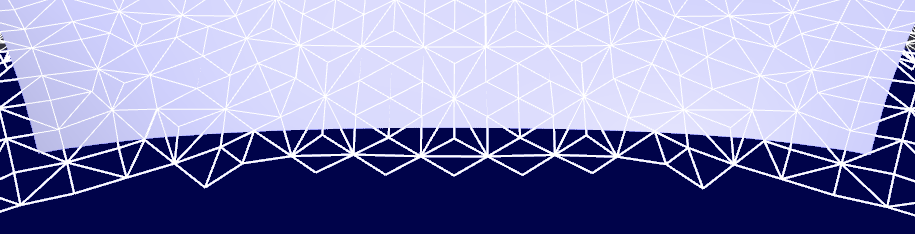
You can compose e.g. a spherical coordinate transform with a stereographic one, animate both, and it works.
It's weird, but I feel like I have to stress and justify that this is Perfectly Fine™... even more, that it's Okay To Do Transcendental Ops In Your Vertex Shader, because I do. I think most graphics dev readers will grok what I mean: focusing on performance-über–alles can smother a whole category of applications in the crib, when the more important thing is just getting to try them out at all.
Dealing with arbitrary transforms poses a problem though. In order to get proper shading in 3D, you need to transform not just the positions, but also the tangents and normals. The solution is a DifferentialContext with a shader function (vector: vec4<f32>, base: vec4<f32>, contravariant: bool) -> vec4<f32>. It will transform the differential vector at a point base in either a covariant (tangent) or contravariant (normal) way.
There's also a differential combinator: it can chain analytical differentials if provided, transforming the base point along. If there's no analytic differential, it will substitute a numeric one instead.
You can e.g. place an implicit surface inside a cylindrical transform, and the result will warp and shade correctly. Differential indicators like tick marks on axes will also orient themselves automatically. This might seem like a silly detail, but it's exactly this sort of stuff that I'm after: ways to make 3D graphics parts more useful as general primitives to build on, rather than just serving as a more powerful triangle blaster.
It's all composable, so all optional. If you place a simple GLTF model into a bare draw pass, it will have a classic projection × view × model vertex shader with vanilla normals and tangents. In fact, if your geometry isn't shaded, it won't have normals or tangents at all.
Content like map tiles also benefits from Use.GPU's sophisticated z-biasing mechanism, to ensure correct visual layering. This is an evolution of classic polygon offset. The crucial trick here is to just size the offset proportionally to the actual point or line width, effectively treating the point as a sphere and the line as tube. However, as Use.GPU has 2.5D points and lines, getting this all right was quite tricky.
But, setting zBias={+1} on a line works to bias it exactly over a matching surface, regardless of the line width, regardless of 2D vs 3D, and regardless of which side it is viewed from. This is IMO the API that you want. At glancing angles zBias automatically loses effect, so there is no popping.
A DSL for DSLs
You could just say "oh, so this is just a domain-specific language for render and compute" and wonder how this is different from any previous plug-and-play graphics solution.
Well first, it's not a proxy for anything else. If you want to do something that you can't do with <Kernel>, you aren't boxed in, because a <Kernel> is just a <Dispatch> with bells on. Even then, <Dispatch> is also replaceable, because a <Dispatch> is just a <Yeet> of a lambda you could write yourself. And a <Compute> is ultimately also a yeet, of a per-frame lambda that calls the individual kernel lambdas.
This principle is pervasive throughout Use.GPU's API design. It invites you to use its well-rounded components as much as possible, but also, to crack them open and use the raw parts if they're not right for you. These components form a few different play sets, each suited to particular use cases and levels of proficiency. None of this has the pretense of being no-code; it merely does low-code in a way that does not obstruct full-code.
You can think of Use.GPU as a process of run-time macro-expansion. This seems quite appropriate to me, as the hairy problem being solved is preparing and dispatching code for another piece of hardware.
Second, there is a lot of value in DSLs for pipeline-like things. Graphs are just no substitute for real code, so DSLs should be real programming languages with escape hatches baked in by default. Much of the value here isn't in the comp-sci cred, but rather in the much harder work of untangling the mess of real-time rendering at the API level.
The resulting programs also have another, notable quality: the way they are structured is a pretty close match to how GPU code runs... as async dispatches of functions which are only partially ordered, and mainly only at the point where results are gathered up. In other words, Use.GPU is not just a blueprint for how the CPU side can look, it also points to a direction where CPU and GPU code can be made much more isomorphic than today.
When fully expanded, the resulting trees can still be quite the chonkers. But every component has a specific purpose, and the data flow is easy to follow using the included Live Inspector. A lot of work has gone into making the semantics of Live legible and memorable.
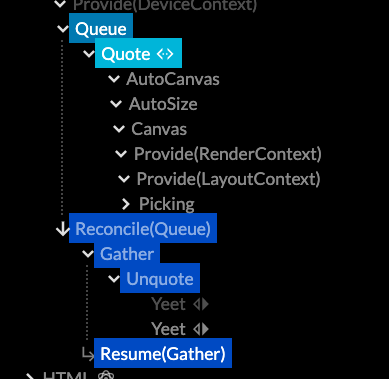
Quoting: it's just like Lisp, but incremental.
Re-re-re-concile
The neatest trick IMO is where the per-frame lambdas go when emitted.
In 0.7, Live treats the draw calls similar to how React treats the HTML DOM: as something to be reconciled out-of-band. But what is being reconciled is not HTML, it's just other Live JSX, which ends up in a new part of the current tree. So this will also run it. You can even portal back and forth at will between the two sub-trees, while respecting data causality and context scope.
Along the way Live has gained actual bona-fide <Quote> and <Unquote> operators, to drive this recursive <Reconcile>. This means Use.GPU now neatly sidesteps Greenspun's law by containing a complete and well-specified version of a Lisp. Score.
You could also observe that the Live run-time could itself be implemented in terms of Quote and Unquote, and you would probably be correct. But this is the kind of code transform that would buy only a modicum of algorithmic purity at the cost of a lot of performance. So I'm not going there, and leave that exercise for the programming language people. And likely that would eventually result in an optimization pass to bring it closer to what it already is today.
My real point is, when you need to write code to produce code, it needs to be Lisp or something very much like it. But not because of purity. It's because otherwise you will end up denying your API consumers affordances you would find essential yourself.
Typescript is not the ideal language to do this in, but under the circumstances, it is one of the least worst. AFAIK no language has the resumable generator semantics Live has, and I need a modern graphics API too, so practical concerns win out instead. Mirroring React is also good, because the tooling for it is abundant, and the patterns are well known by many.
This same tooling is also what lets me import WGSL into TS without reinventing all the wheels, and just piggy backing on the existing ES module system. Though try getting Node.js, TypeScript and Webpack to all agree what a .wgsl module should be for, it's uh... a challenge.
* * *
The story of Use.GPU continues to evolve and continues to get simpler too. 0.7 makes for a pretty great milestone, and the roadmap is looking pretty green already.
There are still a few known gaps and deliberate oversights. This is in part because Use.GPU focuses on use cases that are traditionally neglected in graphics engines: quality vector graphics, direct data visualization, generative geometry, scalable UI, and so on. It took months before I ever added lighting and PBR, because the unlit, unshaded case had enough to chew on by itself.
Two obvious missing features are post-FX and occlusion culling.
Post-FX ought to be a straightforward application of the same pipelines from compute. However, doing this right also means building a good solution for producing derived render passes, such as normal and depth. The same also applies to shadow maps, which are also absent for the same reason.
Occlusion culling is a funny one, because it's hard to imagine a graphics renderer without it. The simple answer is that so far I haven't needed it because rendering 3D worlds is not something that has come up yet. My Subpixel SDF visualization example reached 1 million triangles easily, without me noticing, because it wasn't an issue even on an older laptop.
Most of those triangles are generative points and lines, drawn directly from compact source data:
This is the same video from last time, I know, but here's the thing:
There is not a single browser engine where you could dump a million elements into a page and still have something that performs, at all. Just doesn't exist. In Use.GPU you can get there by accident. On a single thread too. Without the indirection of a retained DOM, you just have code that reduces code that dispatches code to produce pixels.