Drupal.org Explosion and Trends
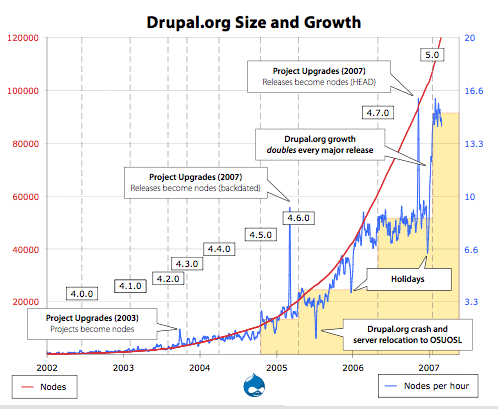
One of the things I do occasionally is collect some of my own statistics on Drupal.org. An interesting one is to look at the size, expressed in nodes, and the growth rate of Drupal.org, expressed as nodes per hour.
Just like rings on a tree trunk, you can see Drupal.org evolve.
Now while the nodes graph (red, left axis) looks exponential at first, it turns out that its growth (blue, right axis) is actually quite stair-stepped. In fact, a remarkable trend can be observed: with every major release of Drupal, Drupal.org's growth rate doubles nearly instantly.
This has been true mostly since Drupal 4.5 and happened recently again with Drupal 5.0. The only exception was a relatively unexpected, but sustained linear growth burst throughout the fall of 2005 and the spring of 2006. There were many high profile projects at that time as well as a lot of anxious waiting for 4.7 (with a long train of betas and release candidates), so it is possible our unnaturally long dev cycle for 4.7 smeared out the growth to a more regular line.
Note that the first year of Drupal is missing, as the statistics were too small to show up.
What's also interesting is that you can clearly see the times when project.module has changed. The first tiny bump is the conversion of projects to nodes, while the other two spikes are the recent conversion of project releases to nodes. For some reason, a huge amount of existing releases got a creation timestamp a while ago, possibly due to some change in project.module housekeeping at that time.
Other noticeable events include the holidays (when activity slows down a lot) as well as the server crash of July 2005, and the subsequent move to OSUOSL.
I've attached the raw Excel Spreadsheet for anyone interested. See if you can match up any other events to the graph.
