Taming complex numbers in Grapher.app
Of all the free extras that Mac OS X has, Grapher has to be one of the coolest. This little app, hidden away in the Applications/Utilities folder, is a powerful graphing tool for mathematical equations and data sets.
As you might expect from Apple, it typesets symbolic math beautifully and produces smooth, anti-aliased graphs. But this isn't just a little tech demo to showcase some of OS X's technologies: Grapher's features blow away your crusty old TI-83, and it comes with its own set of surprises. For example, not only can you save graphs as PDF or EPS, but it can export animations and even doubles as a LaTeX formula editor.
In fact, it does so much that its main weakness is the documentation, which only covers the very basics. The best way to learn Grapher is to look at the handful of included examples, although it might take you a while to find out how to replicate them from scratch.
The other day I needed to quickly graph a couple of things involving complex numbers, and it seemed that Grapher was doing some very freaky shit. Either that, or my math was really rusty. It turned out I'm not as stupid as I thought, and there are some weird caveats with using complex numbers in Grapher. Oddly, there is very little information online about it, so I figured for future reference, I should document the workarounds I discovered.
Let's dive in. Fuck MS Paint, I've got math to do.
Refresher
To type formulas into Grapher, you can use the symbol palette, available in the Window menu, or type away using various keyboard shortcuts:
- Type
^for exponents,_for indices,/for fractions. Grapher understands exponents and other notations, for example the Bessel functionsJn(x). - Use the arrow keys to move around the equation: in and out of parentheses, exponents, fractions, etc. Pay attention to the cursor to see where you're typing.
- Type out greek letter names for the symbols:
alpha,omega,pi. - Common mathematical constants work:
e,π,i. - The very useful 'Copy LaTeX expression' command is hidden away in the editor's right-click menu.
Using complex numbers
At first sight, complex numbers 'just work'. Using i as the imaginary unit, you can use numbers like 1 + 2i or plot graphs like y=eix. You can use the Re() and Im() operators to explicitly extract the real or imaginary part of a complex number and use abs() and arg() to extract the modulus and argument. If an expression's result is complex, Grapher will only plot the real part.
This last bit is where things get tricky, because this silent casting of complex numbers to reals also sometimes happens in intermediate values.
Silent truncation
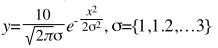
Let's plot a complex parametric curve directly using formulas of the form x + iy=.... As an example, let's look at this:
These equations are using Euler's formula ei·x = cos x + i·sin x to plot a half circle each. The only difference between the two formulas is that the second one is passing its value through the (useless) function f(t).
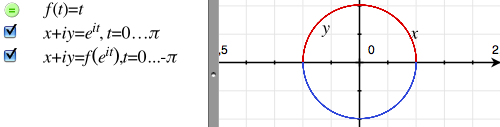
Now if we replace ei·x with 1/ei·x = e–i·x = cos x – i·sin x and change f(t) to 1/t, all that should happen is that the graph is mirrored vertically. Instead, this happens:
The blue circle segment is drawn as a broken horizontal line. What's happening is that Grapher is treating the definition f(t) = 1/t as if it said f(t) = 1/Re(t). In other words, it is truncating the complex input of f(t) to a real number.
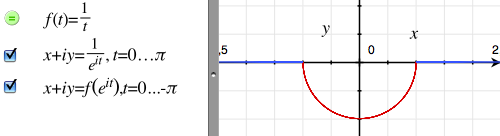
To fix this, you need to replace the variable t with complex(t). This complex() function is listed in the built-in definitions list in the Help menu, but lacks any documentation. With this fix applied, the graph will plot as expected:
Further tests reveal that complex(t) is in fact equivalent to writing out Re(t) + i·Im(t), thus manually recomposing the complex number from its own real and imaginary parts. If it weren't for the existence of the complex() helper, one might consider this issue a bug. The way it is now, it seems this behaviour is somewhat intentional.
Moral of the story: wrap all your function inputs in complex() to avoid nasty surprises.
Broken built-ins
Another annoying issue is that certain built-in functions don't handle complex inputs. To show this, you can try plotting y=sinh(–i2·x). Mathematically, this is equivalent to plotting y=sinh(x) directly. However the presence of the imaginary unit causes the plot to fail.
As a workaround, you need to define your own functions using known formulas and incorporating the complex() fix.
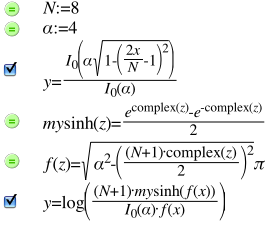
For example, you might define:
fixsinh(x) = (ecomplex(x) – e-complex(x))/ 2

fixcosh(x) = (ecomplex(x) + e-complex(x))/ 2
Other built-ins are trickier. For example, Γ(z) needs replacing, but mathematically it is defined as an improper integral. Unfortunately, Grapher's integrator doesn't seem to handle the definition for Γ(z) at all — though it's supposed to do improper integrals.
When using built-in definitions, always verify that you're getting the results you need with a simple example.
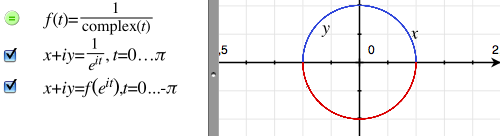
Math porn
To round this off, here's an example where I use these tricks to plot a Kaiser sampling window and its frequency response:
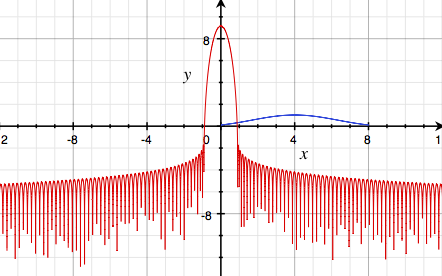
Happy graphing!