Making MathBox
Presentation-Quality Math with Three.js and WebGL
For most of my life, I've found math to be a visual experience. My math scores went from crap to great once I started playing with graphics code, found some demoscene tutorials, and realized I could reason about formulas by picturing the graphs they create. I could apply operators by learning how they morph, shift, turn and fold those graphs and create symmetries. I could remember equations and formulas more easily when I could layer on top the visual relationships they embody. I was less likely to make mistakes when I could augment the boring symbolic manipulation with a mental set of visual cross-checks.
So, when tasked with holding a conference talk on how to make things out of math at Full Frontal—later redone at Web Directions Code—I knew the resulting presentation would have to consist of intricate visualizations as the main draw, with whatever I had to say as mere glue to hold it together.
The problem was, I didn't know of a good tool to do so, and creating animations by hand would probably be too time consuming. With the writings of Paul Lockhart and Bret Victor firmly in mind, I also knew I wanted to start blogging more about mathematical concepts in a non-traditional way, showing the principles of calculus, analysis and algebra the way I learnt to see them in my head, rather than through the obscure symbols served up in engineering school.
So I set out to create that tool, keeping in mind the most important lesson I've picked up as a web developer: one cannot overstate the value in being able to send someone a link and have it just work, right there. It was obvious it would have to be browser-based.
2015 Update: MathBox has evolved, version 2 is now available.
Choose your Poison
Now, when people think of graphs in a browser, the natural thought is vector graphics and SVG, which quickly leads to visualization powerhouse d3.js. It really is an amazing piece of tech with a vast library of useful code to accompany it. When I wrapped my head around how d3's enter/exit selections are implemented and how little it actually does to achieve so much, I was blown away. It's just so elegant and simple.
Unfortunately, d3's core is intricately tied to the DOM through SVG and CSS. And that means ironically that d3 is not really capable of 3D. Additionally, d3 is a power tool that makes no assumptions: it is up to you to choose which visual elements and techniques to use to make your diagrams, and as such it is more like assembly language for graphs than a drop-in tool. These two were show stoppers.
For one, manually designing layouts, grids, axes, etc. every time is tedious. You should be able to drop in a mathematical expression with as little fanfare as possible and have it come out looking right. This includes sane defaults for transitions and animations.
For another, I've found that, when in doubt, adding an extra dimension always helps. The moment I finally realized that every implicit graph in N dimensions is really just a slice of an explicit one in N+1 dimensions, a ridiculous amount of things clicked together. And it took until years after studying signal processing to at long last discover the 4D picture of complex exponentiation that tied the entire thing together (projected into 3D below): it revealed the famous "magic formula" involving e, i and π to be a meaningless symbological distraction, a pinhole view of a much larger, much more beautiful structure, underpinning every Fourier and Z transform I'd ever encountered.
So, WebGL it was, because I needed 3D. Unfortunately that meant the promise of having it just work everywhere was tempered by a lack of browser support, but I would certainly hope that's something we can overcome sooner than later. Dear Apple and Microsoft: get your shit together already. Dear Firefox and Opera: your WebGL performance could be a lot better.
Shady Dealings
These days I don't really touch WebGL without going through Three.js first. Three.js is a wonderful, mature engine that contains tons of useful high-level components. At the same time, it also does a great job in just handling the boilerplate of WebGL while not getting in the way of doing some heavy lifting yourself.
Rendering vector-style graphics with WebGL is not hard, certainly easier than photorealistic 3D. Primitives like lines and points are sized in absolute pixels by default, and with hardware multisampling for anti-aliasing, you get somewhat decent image quality out of it. Though, as is typical for a Web API, we're treated like children and can only cross our fingers and request anti-aliasing politely, hoping it will be available. Meanwhile native developers have full control over speed and quality and can adjust their strategy to the specific hardware's capabilities. The more things change... And then Chrome decided to disable anti-aliasing altogether due to esoteric security issues with buggy drivers. Bah.
Now, when rendering with WebGL, you really have two options. One is to just treat it as a dumb output layer, loading or generating all your geometry in JavaScript and rendering it directly in 3D. With the speed of JS engines today, this can get you pretty far.
The second option is to leverage the GPU's own capabilities as much as possible, doing computations in GLSL through so-called vertex and fragment shader programs. These are run for every vertex in a mesh, every pixel being drawn, and have been the main force driving innovation in real-time graphics for the past decade. With the goal of butter-smooth 60fps graphical goodness, this seemed like the better choice.
Unfortunately, GLSL shaders are rather monolithic things. While you do have the ability to create subroutines, every shader still has to be a stand-alone program with its own main() function. This means you either need to include a shader for every possible combination of operations, or generate shader code dynamically by concatenating pre-made snippets or using #ifdef switches to knock them out. This is the approach taken by Three.js, which results in some very hairy code that is neither easy to read nor easy to maintain.
Having made a prototype, I knew I wanted to show continuous transitions between various coordinate systems (e.g. polar and spherical), knew I needed to render shaded and unshaded geometry, and knew I would need to slot in specific snippets for things like point sprites, bezier curves/surfaces, dynamic tick marks, and more. Sorting this all out Three.js-style would be a nightmare.
So I wrote a library to solve that problem, called ShaderGraph.js. It is best described as a smart code-concatenator, a few steps short of writing a full blown compiler. You feed it snippets of GLSL code, each with one or more inputs and outputs, and these get parsed and turned into lego-like building blocks. Each input/output becomes an outlet, and outlets are wired up in a typical dataflow style. Given a graph of connected snippets, it can be compiled back into a program by assembling the subroutines, assigning intermediate variables and constructing an appropriate main() function to invoke them. It also exports a list of all external variables, i.e. GLSL uniforms and attributes, so you can control the program's behavior easily.
If I'd stopped there however, I'd have just replaced the act of manual code writing with that of manually wiring graphs. So I applied the principle of convention-over-configuration instead: you tell ShaderGraph to connect two snippets, and it will automatically match up outlets by name and type. This is augmented by a chainable factory API, which allows you to pass a partially built graph around. It allows different classes to work together to build shaders, each inserting their own snippets into the processing chain.
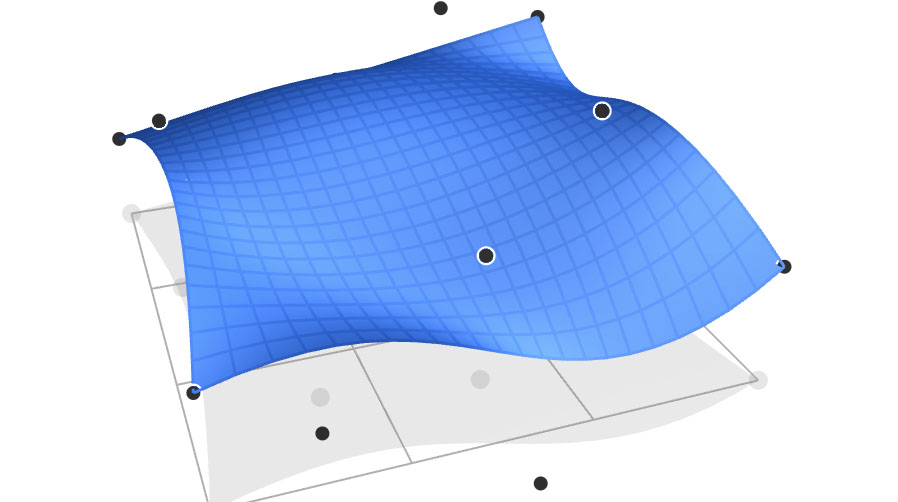
For example, to render a Bezier surface, the vertex shader is composed of: cubic interpolation, viewport transform (position + tangents), normal calculation and lighting. When transforming to e.g. a polar viewport, the surface normals are seamlessly recalculated. It really works like magic and I can't wait to use this in my next WebGL projects.
Viewports, Primitives and Renderables
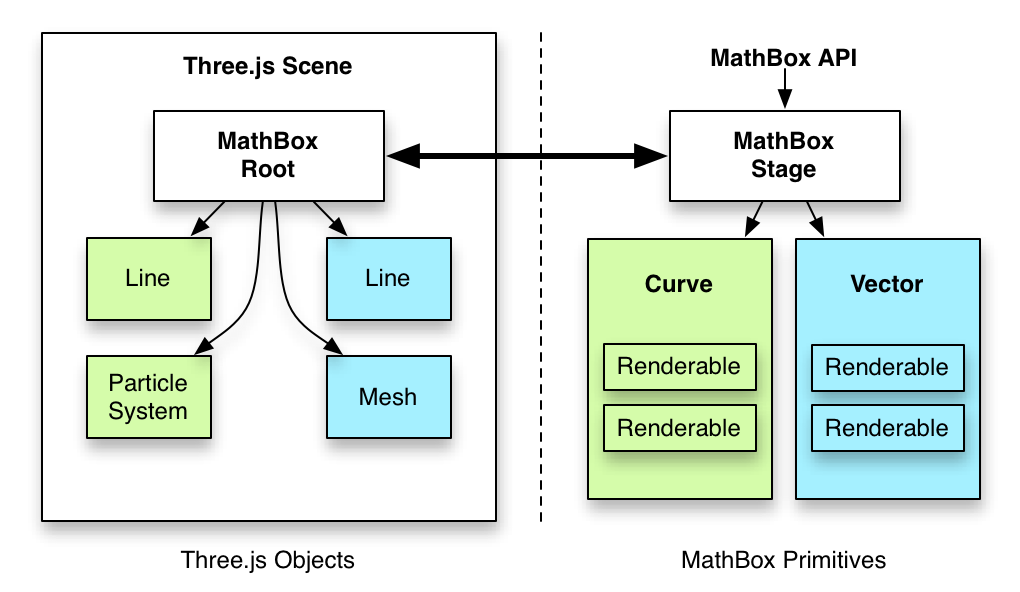
At its core, Three.js matches pretty directly with WebGL. You can insert objects such as a Mesh, Line or ParticleSystem into your scene, which invokes a specific GL drawing command with high efficiency. As such, I certainly didn't want to reinvent the wheel.
Hence, MathBox is set up as a sort of scene-manager-within-a-scene-manager. It's a little sandbox that speaks the language of math, allowing you to insert various primitives like curves, vectors, axes and grids. Each of these primitives then instantiates one or more renderables, which simply wrap a native Three.js object and its associated ShaderGraph material. Thus, once instantiated, MathBox gets out of the way and Three.js does the heavy lifting as normal. You can even insert multiple mathboxen into a Three.js scene if you like, mixed in with other objects.
For example, a vector primitive is rendered as an arrow: it consists of a shaft and an arrowhead, realized as a line segment and a cone. An axis primitive is an arrow as well, but it also has tick marks (specially transformed line segments), and is positioned implicitly just by specifying the axis' direction rather than a start and end point.
To render curves and surfaces, you can either specify an array of data points or a live expression to be evaluated at every point. This turned out to be essential for the kinds of intricate visualizations I wanted to show, my slides being driven by timed clocks, shared arrays of data points, and live formulas and interpolations. I even fed in data from a physics engine, and it worked perfectly.
This is all tied together through Viewport objects, which define a specific mapping from a mathematical coordinate space into the 3D world space of Three.js. For example, the default cartesian viewport has the range [–1, 1] in the X, Y and Z directions. Altering the viewport's extents will shift and scale anything rendered within, as well as reflow grids and tick marks on each axis.
There are two more sophisticated viewport types, polar and spherical, which each apply the relevant coordinate transform, and can transition smoothly to and from cartesian. More viewport types can be added, all that is required is to define an appropriate transformation in JavaScript and GLSL. That said, defining a seamless transition to and from cartesian space is not always easy, particularly if you want to preserve the aspect-ratio through the entire process.
Interpolate all the things!
Finally, I had to tackle the problem of animation, keeping in mind a tip I learnt from the ever so mindbending Vihart: "If I can draw the point of a sentence, I don't actually need to say the sentence." This applies doubly so for animation: every time you replace a "before" and "after" with a smooth transition, your audience implicitly understands the change rather than having to go look for it.
Hence, each primitive can be fully animated. Each has a set of options (controlling behavior) and styles (controlling GLSL shaders), and there is a universal animator that can interpolate between arbitrary data types in a smart fashion.
For example, given a viewport with the XYZ range [[–1, 1], [–1, 1], [–1, 1]], you can tell it to animate to [[0, 2], [0, 1], [–3, 3]], and it just works. The animator will recursively animate each subarray's elements, and any dependent objects like grids and axes will reflow to match the intermediate values. This works for colors, vectors and matrices too. In case of live curves with custom expressions, the animator will invoke both the old and the new, and interpolate between the results.
However, executing animations manually in code is tedious, particularly in a presentation, where you want to be able to step forward and backward. So I added a Director class whose job it is to coordinate things. All you do is feed it a script of steps (add this object, animate that object). Then, as it applies them, it remembers the previous state of each object and generates an automatic rollback script. It also contains logic to detect rapid navigation, and will hurry up animations appropriately. This avoids that agonizing situation of watching someone skip through their slide deck, playing the same cheesy PowerPoint transitions over and over again.
Presenting Naturally
With MathBox's core working, it was time to build my slides for the conference. After a quick survey, I quickly settled on deck.js as an HTML5 slidedeck solution that was clean and flexible enough for my purposes. However, while MathBox can be spawned inside any DOM element, it wouldn't work to insert a dozen live WebGL canvases into the presentation. The entire thing would grind to a halt or at least become very choppy.
So instead, I integrated each MathBox graphic as an IFRAME, and added some logic that only loads each IFRAME one slide before it's needed, and unloads it one slide after it's gone off screen. To sync up with the main presentation, all deck.js navigation events were forwarded into each active IFRAME using window.postMessage. With the MathBox Director running inside, this was very easy to do, and meant that I could skip around freely during the talk, without any worries of desynchronization between MathBox and the associated HTML5 overlays.
In fact, I applied a similar principle to this post. To avoid rendering all diagrams simultaneously and spinning up laptop fans more than necessary, each MathBox IFRAME is started as it scrolls into view and stopped once it's gone.
I've also found that having a handheld clicker makes a huge difference while speaking—as it allows you to gesture freely and move around. So, I grabbed the infrared remote code from VLC and built a simple bridge from to Cocoa to Node.js to WebSocket to allow the remote to work in a browser. It's a shame Apple's decided to discontinue IR ports on their laptops. I guess I'll have to come up with a BlueTooth-based solution when I upgrade my hardware.
Towards MathBox 1.0
In its current state, MathBox is still a bit rough. The selection of primitives and viewports is limited, and only includes the ones I needed for my presentation. That said, it is obvious you can already do quite a lot with it, and I couldn't have been happier to hear that all this effort had the desired response at the conference. I wasn't 100% sure whether other people would have the same a-ha moments that I've had, but I'm convinced more than ever that seeing math in motion is essential for honing our intuition about it. MathBox not only makes animated diagrams much easier to make and share, but it also opens the door to making them interactive in the future.
I plan to continue to evolve MathBox as needed by using it on this site and addressing gaps that come up, though I've already identified a couple of sore points:
- I used tQuery as a boilerplate and because I liked the idea of having a chainable API for this. However, this also means it's currently running off an outdated version of Three.js. I need to look into updating and/or dropping tQuery.
MathBox has been updated to Three.js r53. - Numeric or text labels are completely unsupported. It should be possible to use my CSS3D renderer for Three.js to layer on beautifully typeset MathJax formulas, positioning them correctly in 3D on top of the WebGL render.
I've added labeling for axes. I've integrated MathJax, but it's tricky because the typesetting is painfully slow in the middle of a 60fps render. But it's automatically used if MathJax is present. - All styles have to be specified on a per-object basis. Some form of stylesheet, default styles or class mechanism to allow re-use seems like an obvious next step.
- There are undoubtedly memory leaks, as I was focused first and foremost on getting it to work.
- Expressions that don't change frame-to-frame are still continuously re-evaluated, which is wasteful. There is a
live: falseflag you can set on objects, but it triggers a few bugs here and there. - There needs to be a predictable, built-in way of running a clock per slide to sync custom expressions off of. In my presentation I used a hack of clocks that start once first invoked, but this lacks repeatability.
I added adirector.clock()method that gives you a clock per slide.
Finally, it doesn't take much imagination to imagine a MathBox Editor that would allow you to build diagrams visually rather than having to use code like I did. However, that's a can of worms I'm not going to open by myself, especially because the API is already quite straightforward to use, and the library itself is still a bit in flux. Perhaps this could be done as an extension of the Three.js editor.
You can see what MathBox is really capable of in the conference video. I invite you to play around with MathBox and see what you can make it do. Contributions are welcome, and the architecture is modular enough to allow its functionality to grow for quite some time.