The Pixel Factory
WebGL, GPUs and Math(Box)
http:// acko.net
Steven Wittens

William Thurston (1946-2012)
"I think a lot of mathematics is really about how you understand things in your head. It's people that did mathematics, we're not just general purpose machines, we're people. We see things, we feel things, we think of things. A lot of what I have done in my mathematical career has had to do with finding new ways to build models, to see things, do computations. Really get a feel for stuff.
It may seem unimportant, but when I started out people drew pictures of 3-manifolds one way and I started drawing them a different way. People drew pictures of surfaces one way and I started drawing them a different way. There's something significant about how the representation in your head profoundly changes how you think.
It's very hard to do a brain dump. Very hard to do that. But I'm still going to try to do something to give a feel for 3-manifolds. Words are one thing, we can talk about geometric structures. There are many precise mathematical words that could be used, but they don't automatically convey a feeling for it. I probably can't convey a feeling for it either, but I want to try."
- William Thurston
Pixels
$$ (\color{#3080FF}{x}, \color{#40A020}{y}) $$
Bresenham Line Drawing
True Color?
Red Green Blue Primaries
8-bit per channel
Blending = Linear Interpolation
$$ \begin{array}{ccc} lerp(\color{#F08000}{a}, \color{#0090FF}{b}, \color{#40C090}{t}) = \color{#F08000}{a} + (\color{#0090FF}{b} - \color{#F08000}{a}) \cdot \color{#40C090}{t} & & \color{#40C090}{t} = [0...1] \end{array} $$
Human Color Vision is Additive
(but sRGB is not linear)
Rasterization
Snap to Pixel
Subpixel Accuracy
Samples
Sampling
Vector World
Raster World
Nearest Neighbour Filter
Bilinear Filter
Pixel Coverage?
SuperSampling x 4
MultiSampling x 4
Aliasing - Sampling Theorem
$$ f = f_s / 4 $$
$$ f = f_s / 2 = f_\text{nyquist} $$
$$ f = f_s \approx f_\text{DC} $$
$$ f = 1.7 f_s $$
$$ f = 0.45 f_s $$
$$ f = f_s / 4 $$
⬋ Moiré Patterns ⬊
Need 100s of samples per pixel
(downsize ahead of time)
Depth Sorting
Depth/Z-Buffer
Visibility Per Sample
Z-Buffer - Solid Surfaces Only
Graphics Processing Unit
MathBox
MathBox 2 - Bring your own GLSL
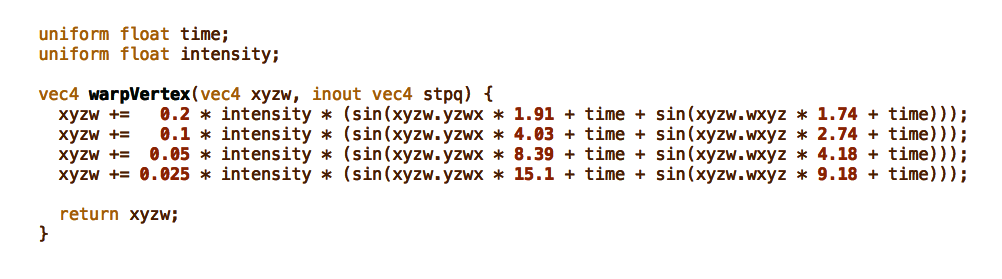
Time Parameter
Intensity Parameter
120,354 vertices @ 60fps = 7.2 million calls / second
XYZ Space
$$ f(\color{#3080FF}{x}, \color{#40A020}{y}, \color{#C02050}{z}, \text{time}, \text{intensity}) \rightarrow (\color{#3080FF}{x}, \color{#40A020}{y}, \color{#C02050}{z}) $$
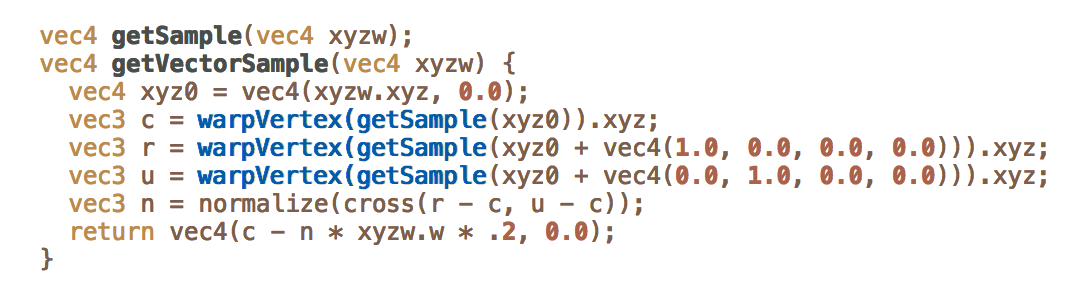
Surface Normals
$$ \color{#18487F}{\vec p} = (\color{#18487F}{p_\color{#3080FF}{x}}, \color{#18487F}{p_\color{#40A020}{y}}, \color{#18487F}{p_\color{#C02050}{z}}) $$
$$ \color{#40B0FF}{\vec n} = (\color{#40B0FF}{n_\color{#3080FF}{x}}, \color{#40B0FF}{n_\color{#40A020}{y}}, \color{#40B0FF}{n_\color{#C02050}{z}}) $$
UV Plane to XYZ Space
$$ \color{#18487F}{\vec p}(\color{#9759d1}{u}, \color{#2fb28c}{v}) = \text{warp}\Big(\text{surface}(\color{#9759d1}{u}, \color{#2fb28c}{v}), \text{time}, \text{intensity}\Big) $$
U Tangents
$$ \color{#9759d1}{\vec U} = \frac{\color{#18487F}{\partial \vec p}}{\color{#9759d1}{\partial u}} \approx \frac{\color{#18487F}{\vec p}\big(\color{#9759d1}{u} + \varepsilon, \color{#2fb28c}{v}) - \color{#18487F}{\vec p}(\color{#9759d1}{u}, \color{#2fb28c}{v}\big)}{\varepsilon} $$
$$ \color{#9759d1}{\vec U} = \frac{\color{#18487F}{\partial \vec p}}{\color{#9759d1}{\partial u}} \approx \frac{\color{#18487F}{\vec p}\big(\color{#9759d1}{u} + \varepsilon, \color{#2fb28c}{v}) - \color{#18487F}{\vec p}(\color{#9759d1}{u}, \color{#2fb28c}{v}\big)}{\varepsilon} $$
V Tangents
$$ \color{#2fb28c}{\vec V} = \frac{\color{#18487F}{\partial \vec p}}{\color{#2fb28c}{\partial v}} \approx \frac{\color{#18487F}{\vec p}\big(\color{#9759d1}{u}, \color{#2fb28c}{v} + \varepsilon) - \color{#18487F}{\vec p}(\color{#9759d1}{u}, \color{#2fb28c}{v}\big)}{\varepsilon} $$
$$ \color{#2fb28c}{\vec V} = \frac{\color{#18487F}{\partial \vec p}}{\color{#2fb28c}{\partial v}} \approx \frac{\color{#18487F}{\vec p}\big(\color{#9759d1}{u}, \color{#2fb28c}{v} + \varepsilon) - \color{#18487F}{\vec p}(\color{#9759d1}{u}, \color{#2fb28c}{v}\big)}{\varepsilon} $$
Vector Cross Product = Normal
$$ \color{#40B0FF}{\vec n} = \frac{\color{#18487F}{\partial \vec p}}{\color{#9759d1}{\partial u}} \times \frac{\color{#18487F}{\partial \vec p}}{\color{#2fb28c}{\partial v}} = \left( \begin{array}{c} \color{#9759d1}{{U_\color{#40A020}{y}}} \color{#2fb28c}{{V_\color{#C02050}{z}}} - \color{#2fb28c}{{V_\color{#40A020}{y}}} \color{#9759d1}{{U_\color{#C02050}{z}}} \\ \color{#9759d1}{{U_\color{#C02050}{z}}} \color{#2fb28c}{{V_\color{#3080FF}{x}}} - \color{#2fb28c}{{V_\color{#C02050}{z}}} \color{#9759d1}{{U_\color{#3080FF}{x}}} \\ \color{#9759d1}{{U_\color{#3080FF}{x}}} \color{#2fb28c}{{V_\color{#40A020}{y}}} - \color{#2fb28c}{{V_\color{#3080FF}{x}}} \color{#9759d1}{{U_\color{#40A020}{y}}} \end{array} \right) = \left( \begin{array}{c} \color{#40B0FF}{n_\color{#3080FF}{x}} \\ \color{#40B0FF}{n_\color{#40A020}{y}} \\ \color{#40B0FF}{n_\color{#C02050}{z}} \end{array} \right) $$
$$ \color{#40B0FF}{\vec n} = \frac{\color{#18487F}{\partial \vec p}}{\color{#9759d1}{\partial u}} \times \frac{\color{#18487F}{\partial \vec p}}{\color{#2fb28c}{\partial v}} = \left( \begin{array}{c} \color{#9759d1}{{U_\color{#40A020}{y}}} \color{#2fb28c}{{V_\color{#C02050}{z}}} - \color{#2fb28c}{{V_\color{#40A020}{y}}} \color{#9759d1}{{U_\color{#C02050}{z}}} \\ \color{#9759d1}{{U_\color{#C02050}{z}}} \color{#2fb28c}{{V_\color{#3080FF}{x}}} - \color{#2fb28c}{{V_\color{#C02050}{z}}} \color{#9759d1}{{U_\color{#3080FF}{x}}} \\ \color{#9759d1}{{U_\color{#3080FF}{x}}} \color{#2fb28c}{{V_\color{#40A020}{y}}} - \color{#2fb28c}{{V_\color{#3080FF}{x}}} \color{#9759d1}{{U_\color{#40A020}{y}}} \end{array} \right) = \left( \begin{array}{c} \color{#40B0FF}{n_\color{#3080FF}{x}} \\ \color{#40B0FF}{n_\color{#40A020}{y}} \\ \color{#40B0FF}{n_\color{#C02050}{z}} \end{array} \right) $$
~2.5 x 850,104 vertices @ 60fps = ~127 million calls / second
(including vector visualization)
Differential Geometry - Jacobian Matrices
$$ J(\color{#9759d1}{u}, \color{#2fb28c}{v}, \color{#d08040}{w}) = \left[ \begin{array}{ccc} \color{#9759d1}{{U_\color{#3080FF}{x}}} & \color{#2fb28c}{{V_\color{#3080FF}{x}}} & \color{#d08040}{{W_\color{#3080FF}{x}}} \\ \color{#9759d1}{{U_\color{#40A020}{y}}} & \color{#2fb28c}{{V_\color{#40A020}{y}}} & \color{#d08040}{{W_\color{#40A020}{y}}} \\ \color{#9759d1}{{U_\color{#C02050}{z}}} & \color{#2fb28c}{{V_\color{#C02050}{z}}} & \color{#d08040}{{W_\color{#C02050}{z}}} \end{array} \right] $$
$$ J(\color{#9759d1}{u}, \color{#2fb28c}{v}, \color{#d08040}{w}) = \left[ \begin{array}{ccc} \color{#9759d1}{{U_\color{#3080FF}{x}}} & \color{#2fb28c}{{V_\color{#3080FF}{x}}} & \color{#d08040}{{W_\color{#3080FF}{x}}} \\ \color{#9759d1}{{U_\color{#40A020}{y}}} & \color{#2fb28c}{{V_\color{#40A020}{y}}} & \color{#d08040}{{W_\color{#40A020}{y}}} \\ \color{#9759d1}{{U_\color{#C02050}{z}}} & \color{#2fb28c}{{V_\color{#C02050}{z}}} & \color{#d08040}{{W_\color{#C02050}{z}}} \end{array} \right] $$
Affine vs Projective Matrix
$$ \left[ \begin{array}{ccc} \color{#9759d1}{{U_\color{#3080FF}{x}}} & \color{#2fb28c}{{V_\color{#3080FF}{x}}} & \color{#d08040}{{W_\color{#3080FF}{x}}} \\ \color{#9759d1}{{U_\color{#40A020}{y}}} & \color{#2fb28c}{{V_\color{#40A020}{y}}} & \color{#d08040}{{W_\color{#40A020}{y}}} \\ \color{#9759d1}{{U_\color{#C02050}{z}}} & \color{#2fb28c}{{V_\color{#C02050}{z}}} & \color{#d08040}{{W_\color{#C02050}{z}}} \end{array} \right] $$
$$ \left[ \begin{array}{cccc} \color{#9759d1}{{U_\color{#3080FF}{x}}} & \color{#2fb28c}{{V_\color{#3080FF}{x}}} & \color{#d08040}{{W_\color{#3080FF}{x}}} & \color{#18487F}{p_\color{#3080FF}{x}} \\ \color{#9759d1}{{U_\color{#40A020}{y}}} & \color{#2fb28c}{{V_\color{#40A020}{y}}} & \color{#d08040}{{W_\color{#40A020}{y}}} & \color{#18487F}{p_\color{#40A020}{y}} \\ \color{#9759d1}{{U_\color{#C02050}{z}}} & \color{#2fb28c}{{V_\color{#C02050}{z}}} & \color{#d08040}{{W_\color{#C02050}{z}}} & \color{#18487F}{p_\color{#C02050}{z}} \\ \color{#9759d1}{{U_\color{#487F18}{w}}} & \color{#2fb28c}{{V_\color{#487F18}{w}}} & \color{#d08040}{{W_\color{#487F18}{w}}} & 1 \end{array} \right] $$
$$ \left[ \begin{array}{ccc} \color{#9759d1}{{U_\color{#3080FF}{x}}} & \color{#2fb28c}{{V_\color{#3080FF}{x}}} & \color{#d08040}{{W_\color{#3080FF}{x}}} \\ \color{#9759d1}{{U_\color{#40A020}{y}}} & \color{#2fb28c}{{V_\color{#40A020}{y}}} & \color{#d08040}{{W_\color{#40A020}{y}}} \\ \color{#9759d1}{{U_\color{#C02050}{z}}} & \color{#2fb28c}{{V_\color{#C02050}{z}}} & \color{#d08040}{{W_\color{#C02050}{z}}} \end{array} \right] $$
$$ \left[ \begin{array}{cccc} \color{#9759d1}{{U_\color{#3080FF}{x}}} & \color{#2fb28c}{{V_\color{#3080FF}{x}}} & \color{#d08040}{{W_\color{#3080FF}{x}}} & \color{#18487F}{p_\color{#3080FF}{x}} \\ \color{#9759d1}{{U_\color{#40A020}{y}}} & \color{#2fb28c}{{V_\color{#40A020}{y}}} & \color{#d08040}{{W_\color{#40A020}{y}}} & \color{#18487F}{p_\color{#40A020}{y}} \\ \color{#9759d1}{{U_\color{#C02050}{z}}} & \color{#2fb28c}{{V_\color{#C02050}{z}}} & \color{#d08040}{{W_\color{#C02050}{z}}} & \color{#18487F}{p_\color{#C02050}{z}} \\ \color{#9759d1}{{U_\color{#48187F}{w}}} & \color{#2fb28c}{{V_\color{#48187F}{w}}} & \color{#d08040}{{W_\color{#48187F}{w}}} & 1 \end{array} \right] $$
Pixel Shader
1920 ⨉ 1080 pixels @ 60fps = 124 million calls / second
Generated Vertex Shader


Nvidia GTX 980 · 336 GB/s · 5.2 billion transistors · 5 TFLOPS
AMD R9 390X · 384 GB/s · 3.3 trillion bits/s
2007 · 5 Trillion FLoating-point OPS = 1 supercomputer rack

Alien: Isolation


Crysis 3 (PC/360/PS3)

Killzone: Shadow Fall (PS4)

Supercomputing is now background radiation
WebGL
The Good, The Bad and The Ugly

Pre-allocate as much as possible,
avoid garbage collection

Text Rendering - Signed Distance Fields


Synchronous Shader Compile :/

Floating Point Readback
(32-bit float → 32-bit RGBA)

Multisampling or Post-Processing:
Pick One
(Order Independent Transparency: Two Passes)


WebGLStats.com (Florian Bösch)
Live Performance Scaling = Near impossible

I wanna be a real API!

Where would WebGL be without Three.js?

WebGL 2?
WebVulkan?
